Hello! I’m Jooyoung Kim, a mixing engineer and music producer.
Recently, I mentioned that I had written a simple paper in Korean. Initially, it was just a school assignment, but I decided to submit it as a formal paper rather than letting it collect dust.
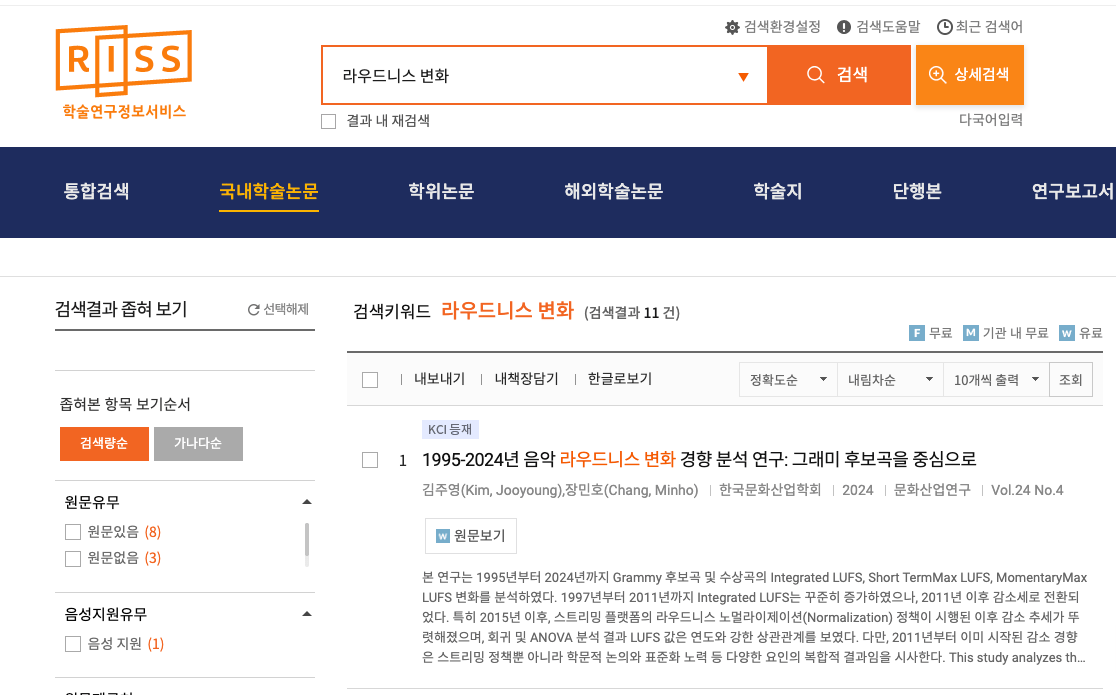
Today, I searched for it on RISS and found that it’s officially listed! So, I’d like to share some insights from it.
As the title suggests, this paper involved a lot of hands-on work and analysis. Here’s what I did:

- I tracked down GRAMMY Record of the Year nominees from 1995 to 2020 that were released on CD, importing the CDs directly from Japan.
- From 2021 onward, CDs were no longer released due to declining sales. For these years (2021–2024), I purchased FLAC 44.1kHz/16-bit files for the nominees.
- I extracted FLAC files from the CDs and measured their loudness values using the Youlean Loudness Meter.

This meter allowed me to measure Momentary Max, Short-Term Max, and Integrated Max LUFS (Loudness Units Full Scale). Using this tool, I processed a total of 520 songs.
Data Analysis
For analysis, I used common statistical methods like linear regression and ANOVA. While the statistical methods might not be particularly meaningful to engineers or artists, the results are worth noting.
In summary, I observed:
- Starting in 2015 (just before loudness normalization became standard across music streaming platforms), the 3-year moving average of loudness began to decrease significantly in a linear trend.
- Let’s break down the results with some key points about loudness:
- LUFS (Loudness Units Full Scale) measures the perceived loudness of audio.
- A value of 0 LUFS represents the maximum output level. Lower values (negative) indicate quieter audio.
Average Integrated LUFS by Year
Integrated LUFS represents the average loudness of a track from start to finish. Here’s the year-by-year trend:
| Year | Average Integrated LUFS |
|---|---|
| 2011 | -7.9668 |
| 2012 | -8.7532 |
| 2013 | -8.5582 |
| 2014 | -9.17 |
| 2015 | -7.5467 |
| 2016 | -8.7710 |
| 2017 | -8.4776 |
| 2018 | -8.27 |
| 2019 | -8.7814 |
| 2020 | -8.6533 |
| 2021 | -8.1338 |
| 2022 | -9.145 |
| 2023 | -8.706 |
| 2024 | -8.8175 |
This data reflects the overall average loudness of music in recent years.
Momentary Max LUFS by Year
Momentary Max LUFS represents the peak loudness within a short 0.4-second window. Below is the year-by-year trend:
| Year | Average Momentary Max LUFS |
|---|---|
| 2011 | -4.3868 |
| 2012 | -5.0709 |
| 2013 | -4.5377 |
| 2014 | -5.1439 |
| 2015 | -4.2238 |
| 2016 | -4.8648 |
| 2017 | -4.4562 |
| 2018 | -4.5686 |
| 2019 | -4.9491 |
| 2020 | -4.9752 |
| 2021 | -4.4825 |
| 2022 | -5.125 |
| 2023 | -4.944 |
| 2024 | -4.6863 |
Takeaways for Audio Engineers
From this analysis, I’ve noticed two important trends:
- Integrated Loudness Levels:
- In recent years, tracks with Integrated LUFS around -8 to -9 LUFS seem to be well within acceptable ranges, meaning engineers no longer need to obsess over achieving higher loudness levels.
- Peak Loudness (Momentary Max LUFS):
- Most highlights in songs fall within -4 to -5 LUFS. Standard deviation has also decreased over time, suggesting a narrowing range in peak loudness levels.
These findings could serve as helpful guidelines for mixing and mastering.
Personal Notes
Currently, I’m working on another audio-related paper using LaTeX—a tool that feels more like coding than writing! While it’s challenging, I’m preparing this paper for submission to the ASA (Acoustical Society of America), aiming for SCI recognition.
If rejected, I’ll submit it to AES (Audio Engineering Society) instead—or another venue if necessary.
I hope these insights into loudness trends prove useful for those in music production and audio engineering! If you have any questions about loudness, feel free to reach out via email.
See you in the next post! 😊
