Hi! This is Jooyoung Kim, mixing engineer and music producer.
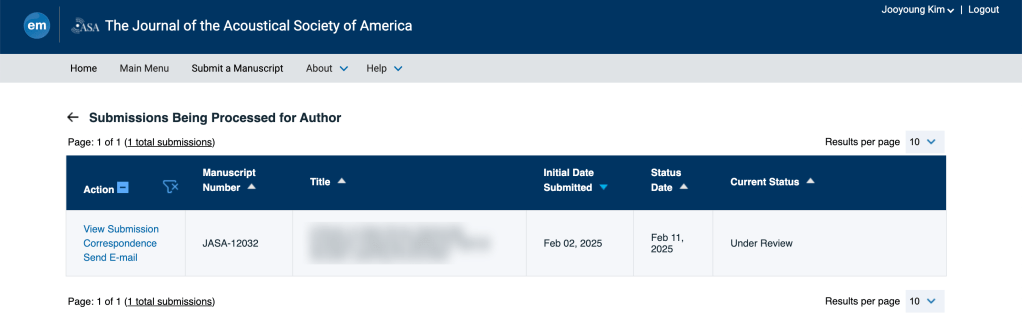
The paper I submitted to JASA is currently under review.
The assigned editor is a renowned scholar in the field of acoustic signal processing at Tsinghua University. I’m more nervous than I was during my college exams..
By the way, today we will talk about the aliasing and sampling theorem – the basic knowledge for mastering audio.
Let’s start!!
Aliasing
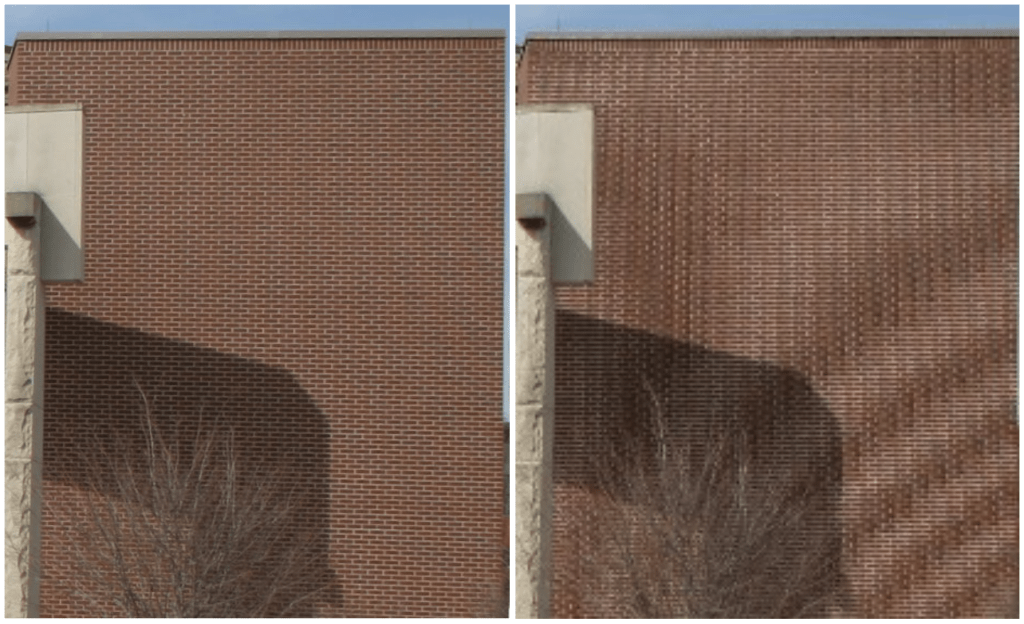
Aliasing is a phenomenon caused by converting analog data to digital data. You can see the same picture; the left one looks normal, but the right one appears distorted. The right image was made by resizing left image in low resolution.
Why does it happen?
Nyquist-Shannon Sampling Theorem
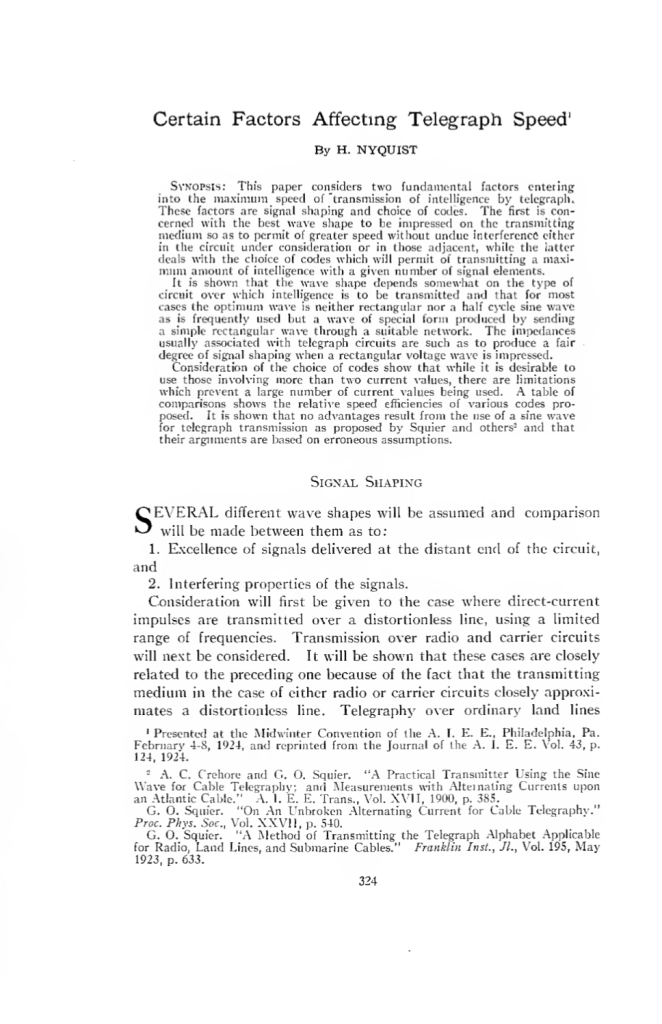
A study on factors affecting transmission published by Nyquist in 1924. Reading the paper, it seems that there were studies at the time that showed that waveforms such as sine waves, triangle waves, and square waves had a significant impact on transmission.
But the courageous Mr. Nyquist says in a strong tone that this is not the case…chill guy..
Nyquist laid the foundation for sampling theory through his research on telegraphy in 1924 and 1928.
Claude E. Shannon expanded on this in his 1949 paper, ‘Communication in the Presence of Noise,’ which solidified the modern sampling theory. If you are curious about what kind of paper was actually written, I have included a link so please take a look..
For those working in music and audio, the finer details aren’t crucial, so I’ll focus on the key points.
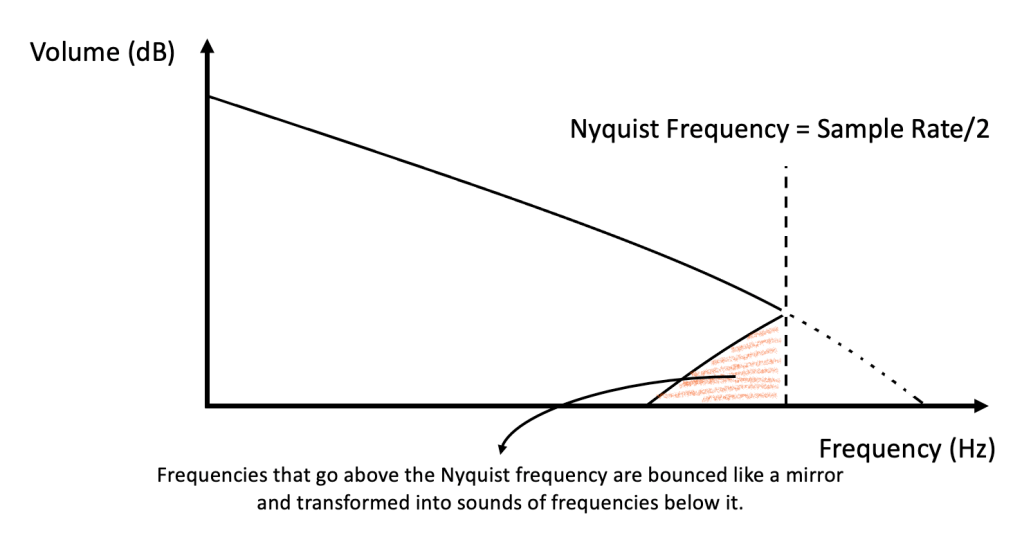
1) Only frequencies up to half the sampling rate can be accurately represented (this is known as the Nyquist frequency).
2) The original source with a value higher than the Nyquist frequency is expressed as a value below the Nyquist frequency when sampled (this is the aliasing phenomenon).
3) Therefore, if you filter it in the high-pass to filter out this noise, it becomes clean (this is called the anti-aliasing filter, The original Nyquist paper made telegraph transmission easier through this filtering).
The blocky artifact shown in the first image is also a form of aliasing caused by sampling errors. Since it samples space, it is a bit different from the sound of sampling time.
An ADC (Analog-to-Digital Converter) chip performs these tasks!
High-end ADCs and DACs improve the precision of this process.. Still, Lavry Gold converters are extremely expensive… Maybe due to low demand?
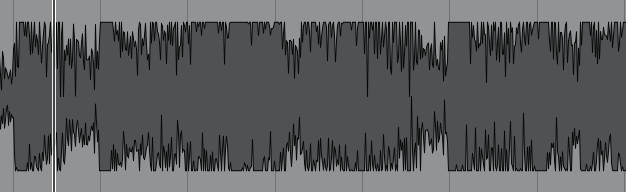
The first part of this video shows how aliasing sounds when you lower the sample rate. Using a filter before this plugin to remove frequencies near the Nyquist limit will significantly reduce aliasing noise.
That’s all for today.
In the next article, I will talk about oversampling and upsampling.
Hi! This is Jooyoung Kim, mixing engineer and music producer.
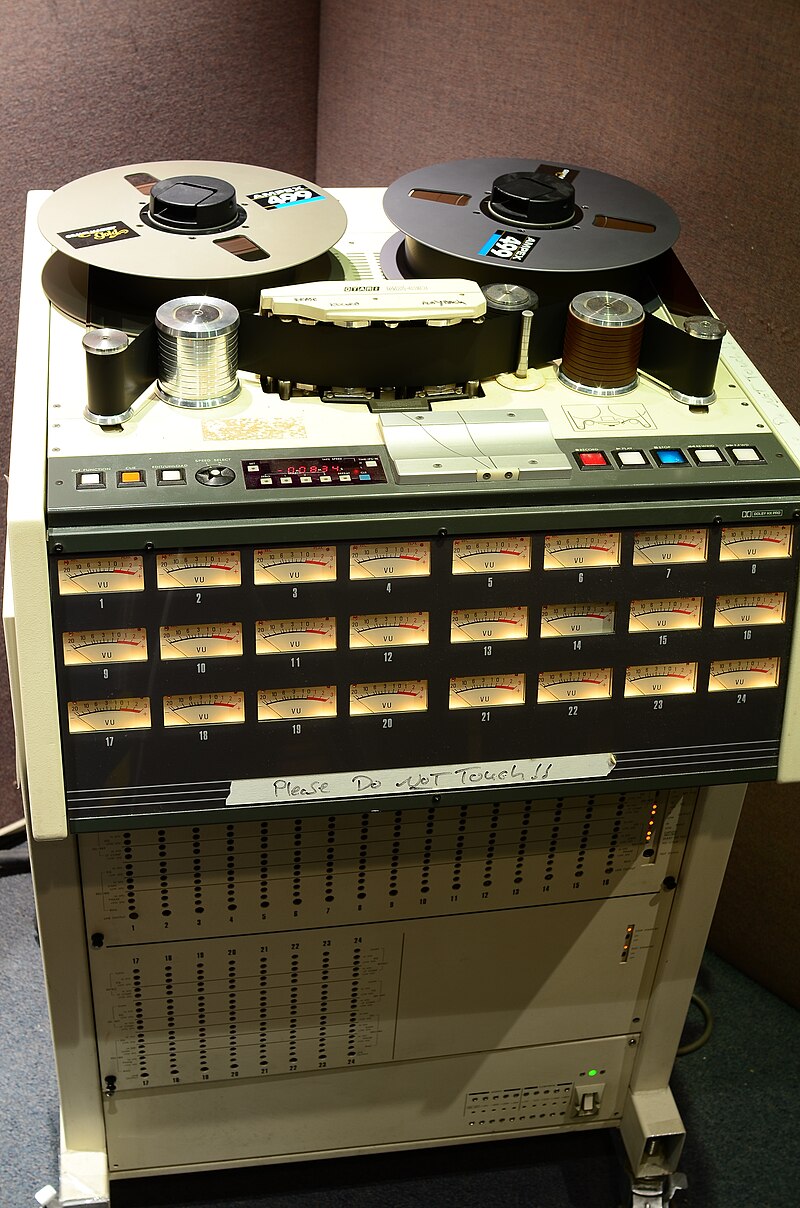
A few days ago, I met my teacher, who taught me guitar and MIDI. We talked about various topics, including tape machine plugins. That conversation inspired me to write a blog post about using tape machine plugins.
If you purchase a plugin through a link in this article, I may receive a small commission.
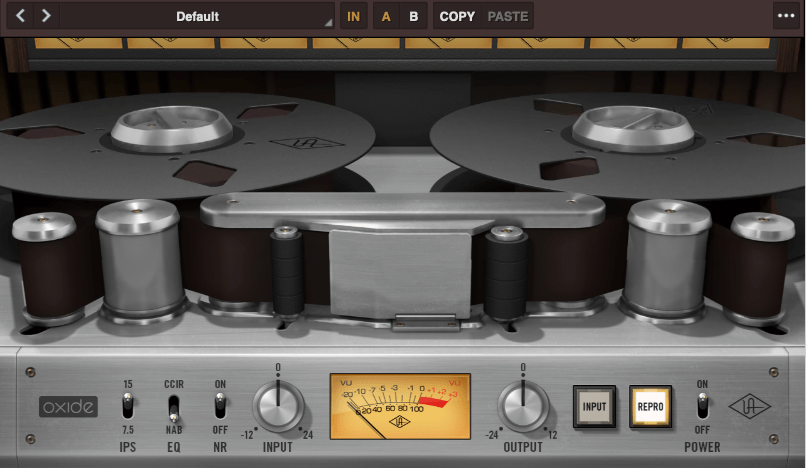
Oxide Tape Recorder is one of the best tape machine plugin made by UAD. The user interface of the Oxide Tape Recorder is simple and intuitive.
IPS means “Inches Per Second”. For example, when IPS is 15, the tape moves 15 inches per one second.
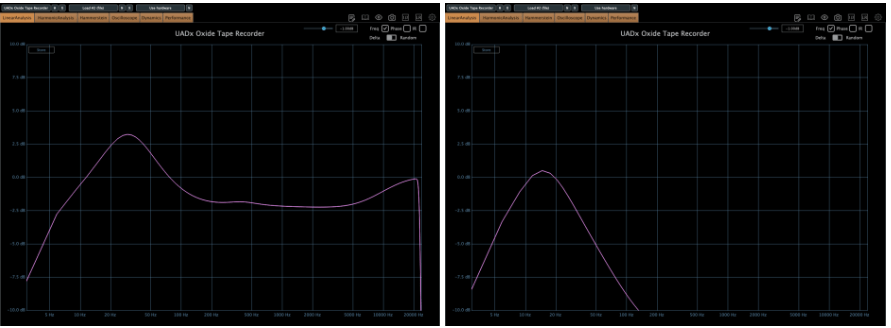
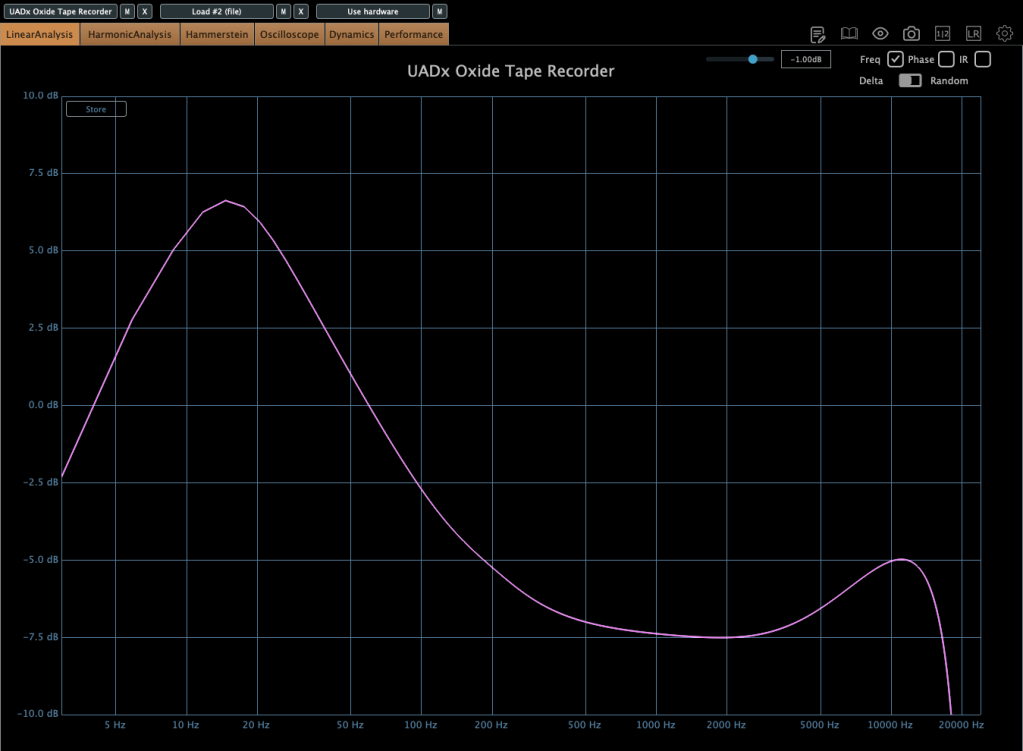
When EQ parameter is on NAB, left side is the frequency response of IPS 15, the other side is IPS 7.5
More gain at IPS 7.5
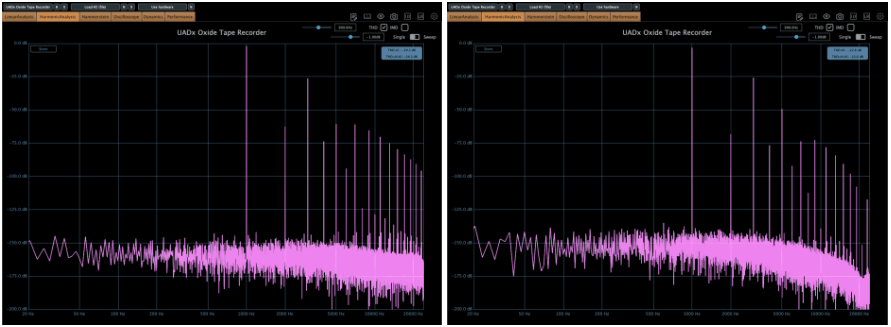
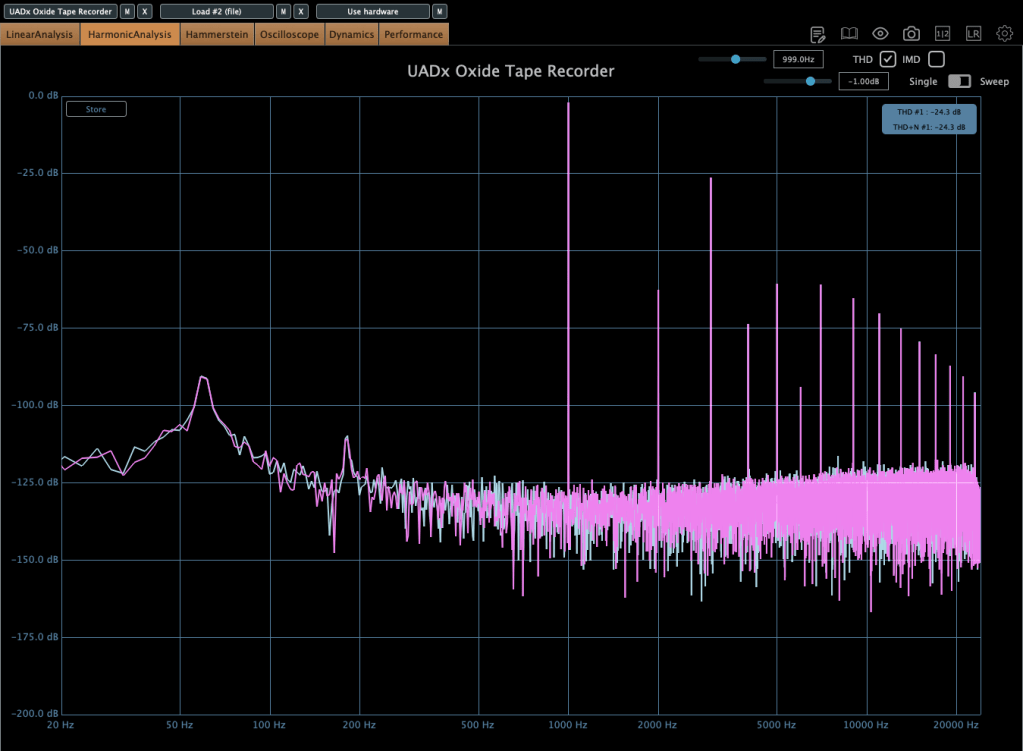
When EQ parameter is on NAB, left side is the harmonic distortion of IPS 15, the other side is IPS 7.5
You can see how IPS affects the frequency response and harmonic distortion.
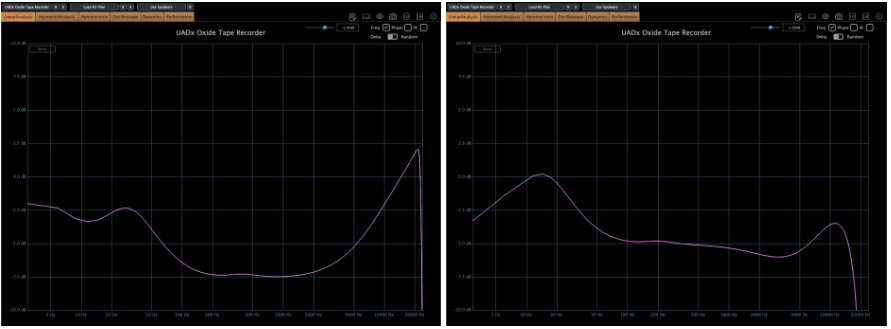
When EQ parameter is on CCIR, left side is the frequency response of IPS 15, the other side is IPS 7.5
If the input gain is too high, compression acts like a soft clipper.
The EQ parameter has two different values: NAB(National Association of Broadcasters) & CCIR(Comité Consultatif International des Radiocommunications, Now ITU-R)
People used to emphasize high frequency by recording process with tape recorder. This is due to high-frequency loss caused by the tape head and the machine. And then, de-emphasize the high frequency when the costumer play the tape.
At those situations, the EQ called NAB & CCIR was used.
NAB was the standard of the electricity with 60Hz alternating current like USA, and CCIR was the standard of 50Hz alternating current like EU(European Union).
The NAB standard sounds smoother and warmer than CCIR, whereas CCIR sounds clearer and sharper than NAB. It means CCIR more emphasize the high frequency field. You can see how the two differ by the upper frequency response graph.
The NR parameter means just “Noise Reduction”. If it turns off, the noise occurs.
That’s all you need to know about the Oxide Tape Recorder plugin. Simple!
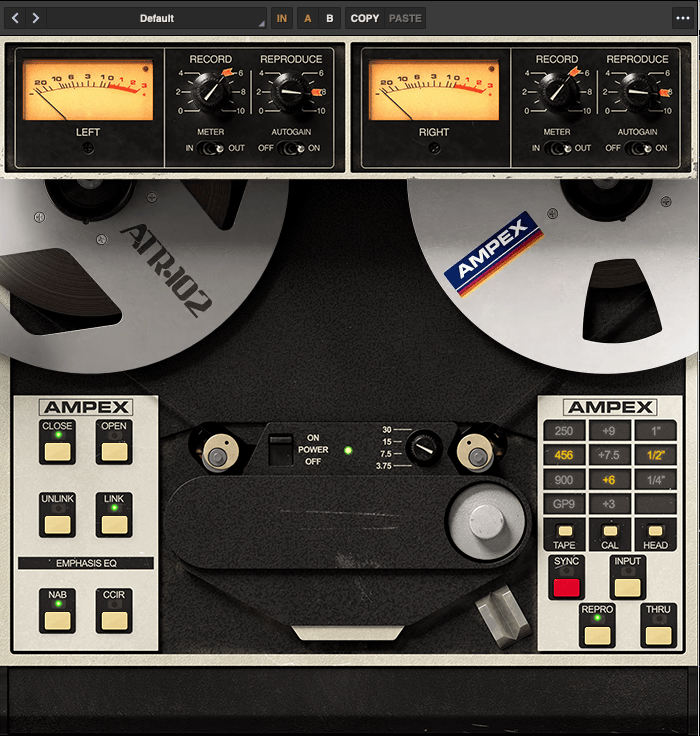
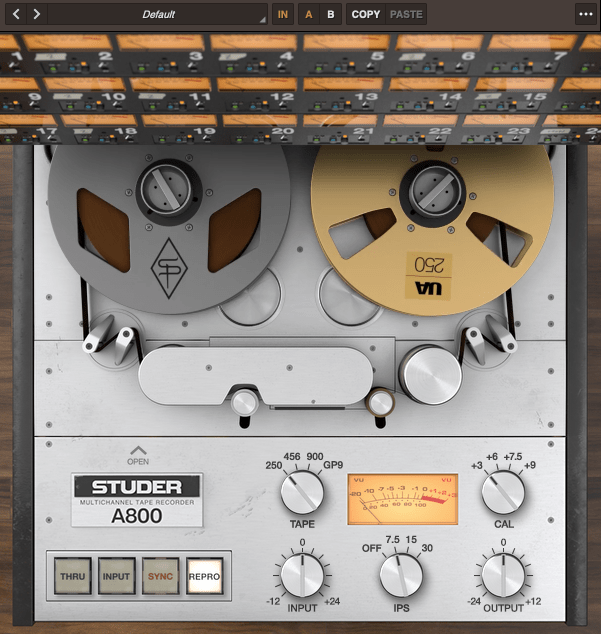
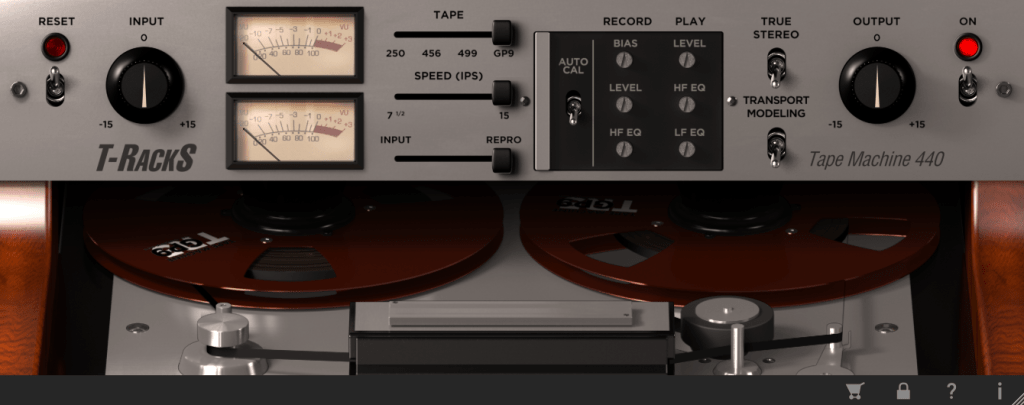
The parameters of the Ampex ATR-102 Master Tape are not as simple as those of the Oxide Tape Recorder. However, if you understand NAB, CCIR, and IPS, it’s easy to use.
Let’s see the parameters.
The record(input) and reproduce(output) knobs are located at the top of the plugin.
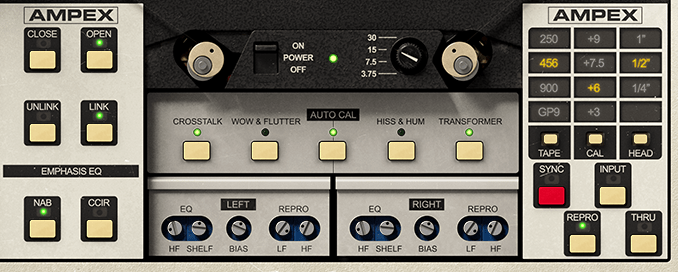
Down side of the plugin, there are buttons that enable detailed adjustments(open and close), and to choose NAB or CCIR.
The right side, you could change type of the tape, calibrate the volume, and choose the tape head width.
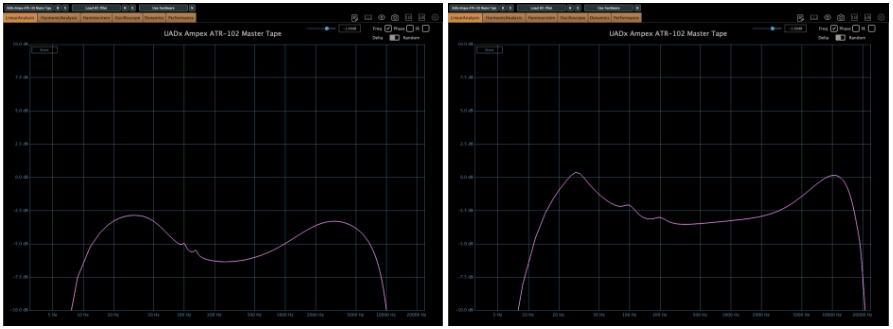
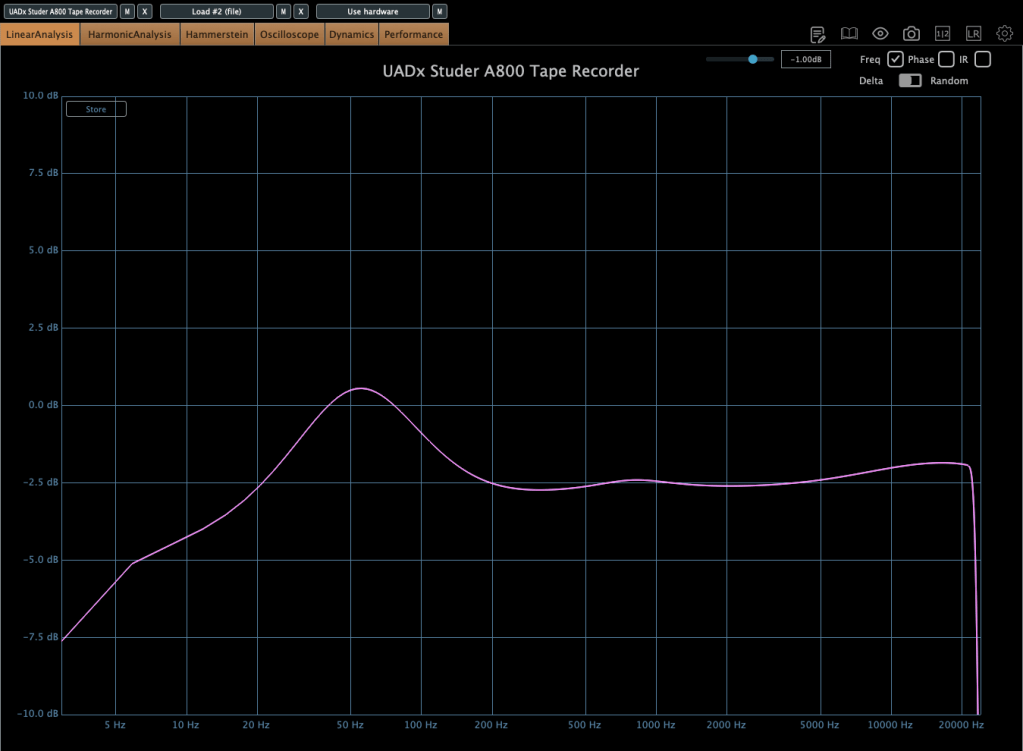
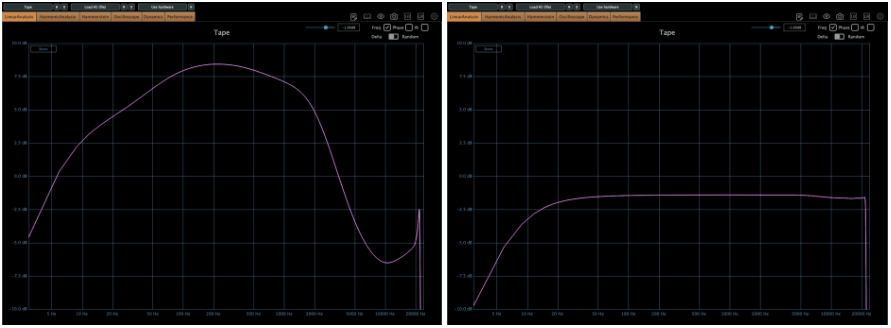
Based on 250 tape and NAB(when you choose IPS 30, couldn’t choice Emphasis EQ),
Left – IPS 3.75, Right – IPS 7.5
Left – IPS 15, Right – IPS 30
there are significant differences in frequency response.
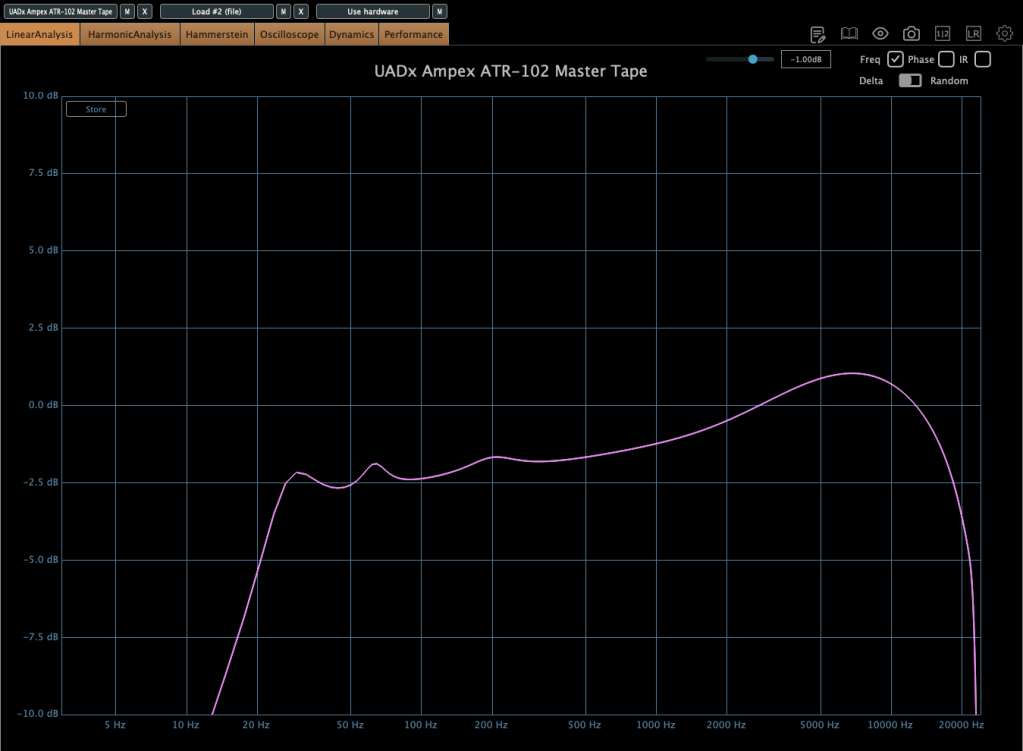
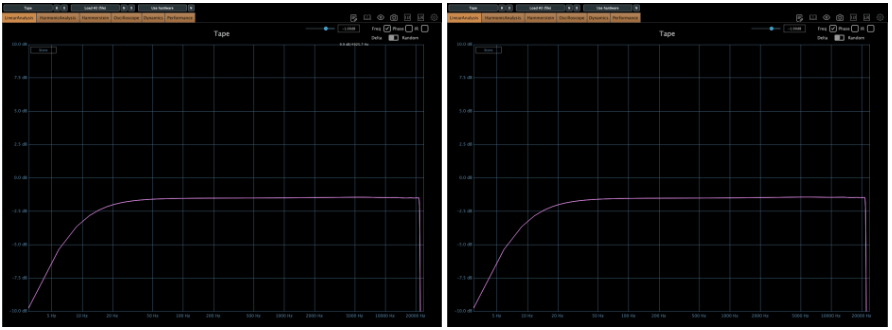
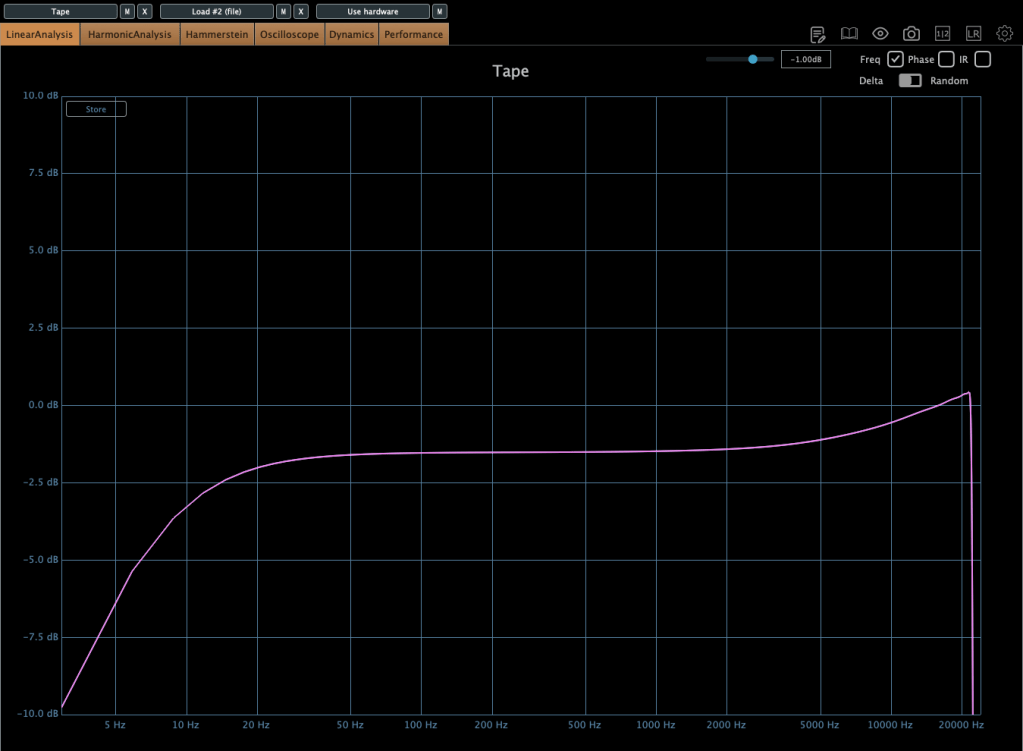
When the tape speed is at IPS 15, this graph shows how the frequency response change by selecting NAB to the other(CCIR).
Input gain and output gain value also make some difference, but it’s not that important..
Compression characteristic is unusual – increase high-volume signals even more – however, it’s not a noticeable difference, so I’ll skip the explanation.
Now, without further ado, you can think of it as a friend that emphasizes the low range, and the frequency response changes like this depending on the IPS!
IK Multimedia makes various plugins like virtual instruments, mixing and mastering effects – their tape machine plugins are really great.
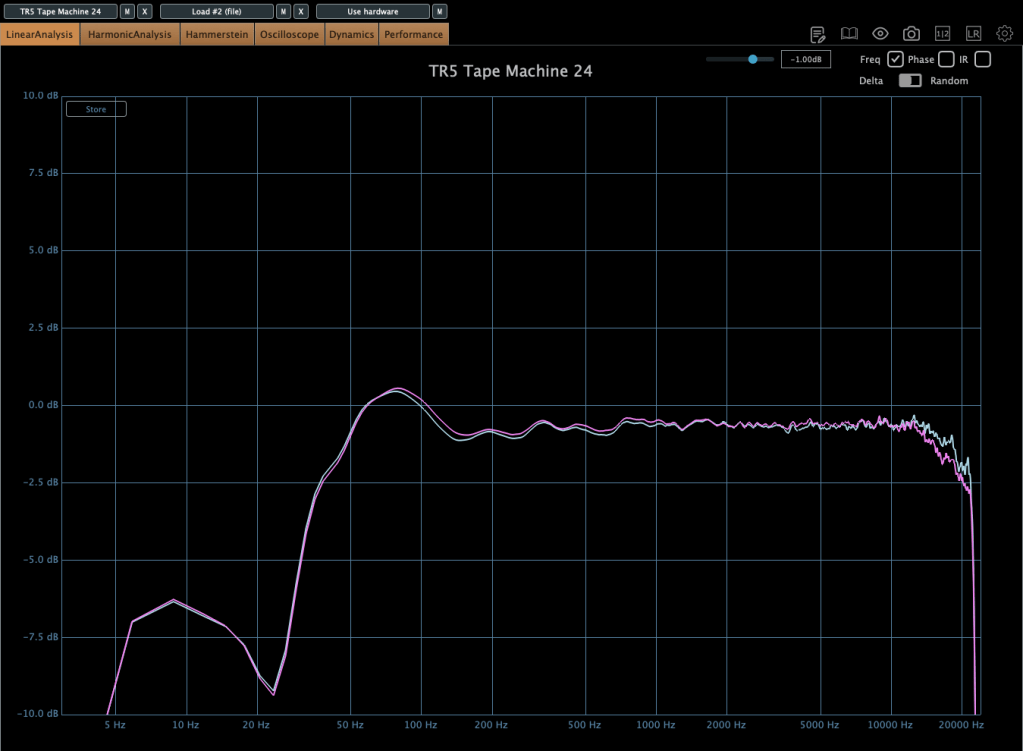
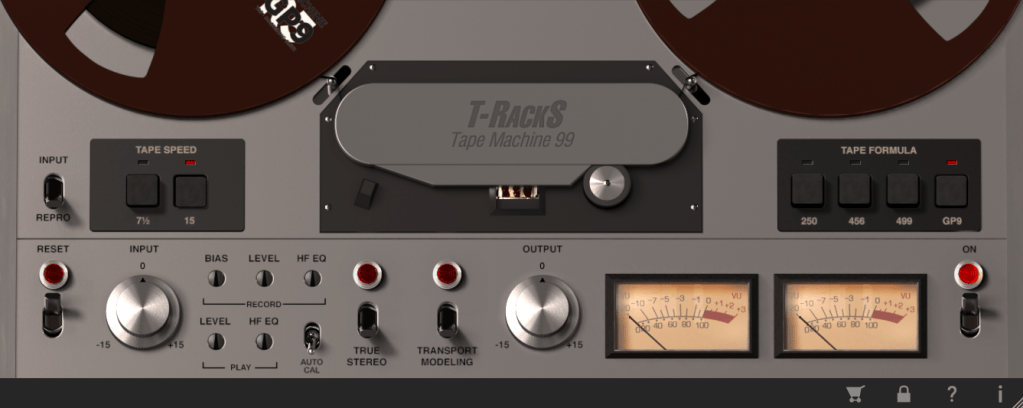
The total bundle sale started on Black Friday, but it’s still on sale. T-racks 5 MAX included in the total bundle includes a total of four tape machine plug-ins: Tape Machine 24, 80, 99, and 440. Let’s look around.
Parameters seems similar.. Tape types, IPS..
IPS 15 in GP9 tape
True stereo parameter makes the difference response between left and right, and transport modeling makes the variation value of the volume by time.
IPS 30 in GP9 tape
The other plugins’ parameters are same as Tape Machine 24 plugin. Just the machines are different, and they make difference in frequency response.
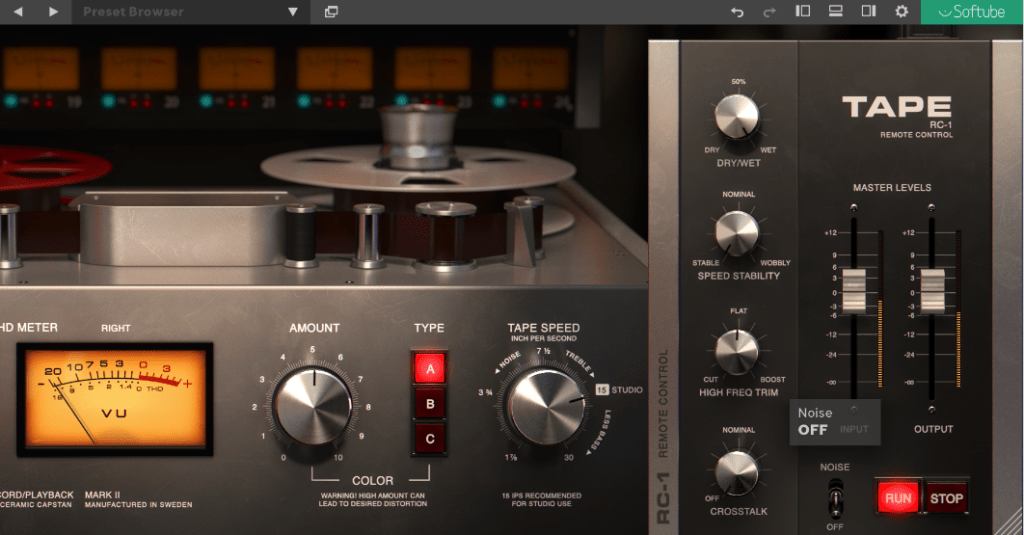
Softube’s Tape plugin is very clean tape machine plugin. The harmonic distortion quantity could changeable by Amount parameter, and tape type could be selected by the Type parameter. (Type A is clean side, B has quit a lot of low frequencies, C has the characteristic between A and B)
Left – Default type A, Right – Default type B
Default type C
Tape speed could be changed by IPS too.
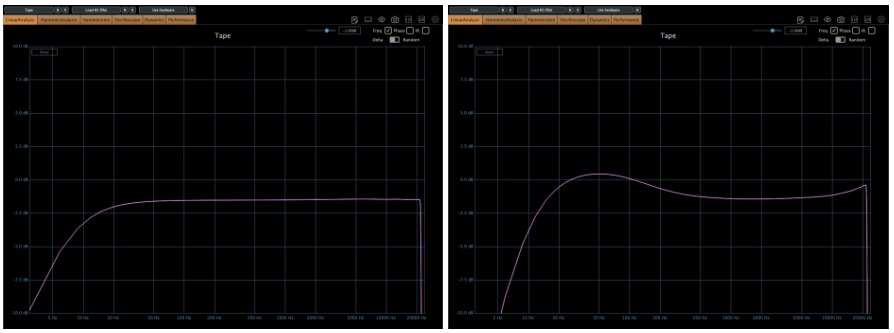
Type A tape Left – IPS 7/8, Right – IPS 3 3/4
Type A tape Left – IPS 7 1/2, Right – IPS 15
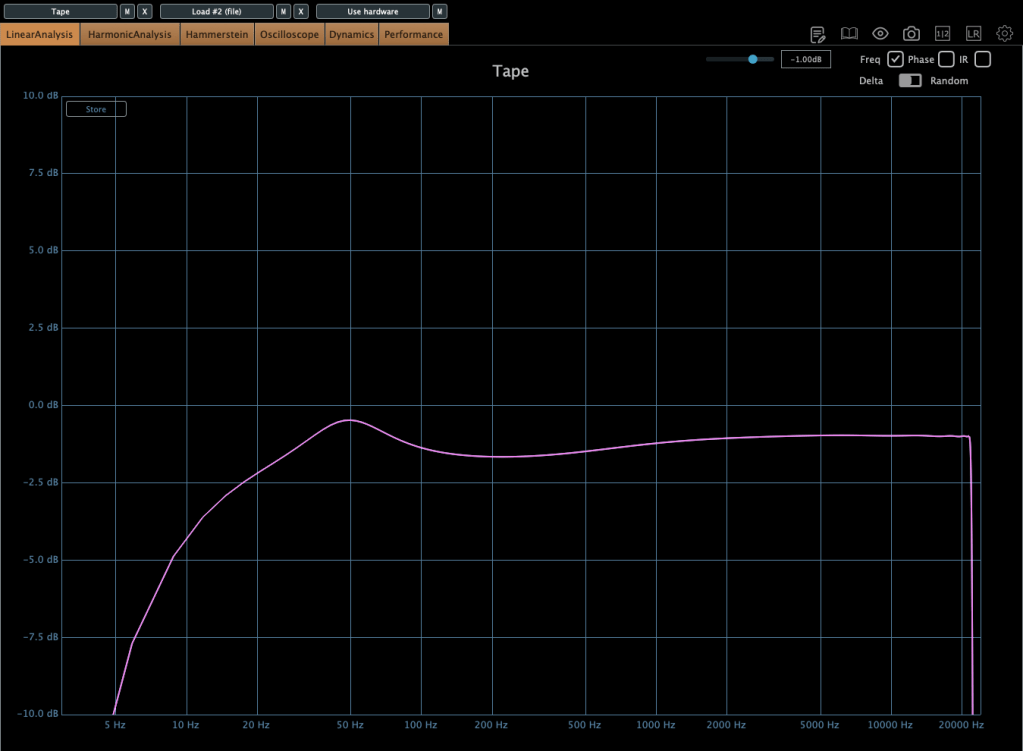
Type A tape IPS 30
Waves also has a famous tape machine plugin called Kramer and J37, but as I was writing this, the patterns became too similar, so I will omit them.
However, there is a parameter called Bias that exists only in Waves.
Hi! This is Jooyoung Kim, mixing engineer & music producer.
Before, we talked about hardware. Today, I’ll begin by introducing mastering. This article is based on my book, Basics of Mixing, published in South Korea.
Let’s dive in!
What is Mastering?
Why do we master audio?
The loudness of mixed music is too low
So gain more volume for the mixed music, maintaining the instruments’ balance
Of course, mastering involves many aspects. You can easily understand mastering with the two sentences above.
Simply put, mastering is the final step in music production. It can also be described as packaging the mixed music. The package does not change after mastering.
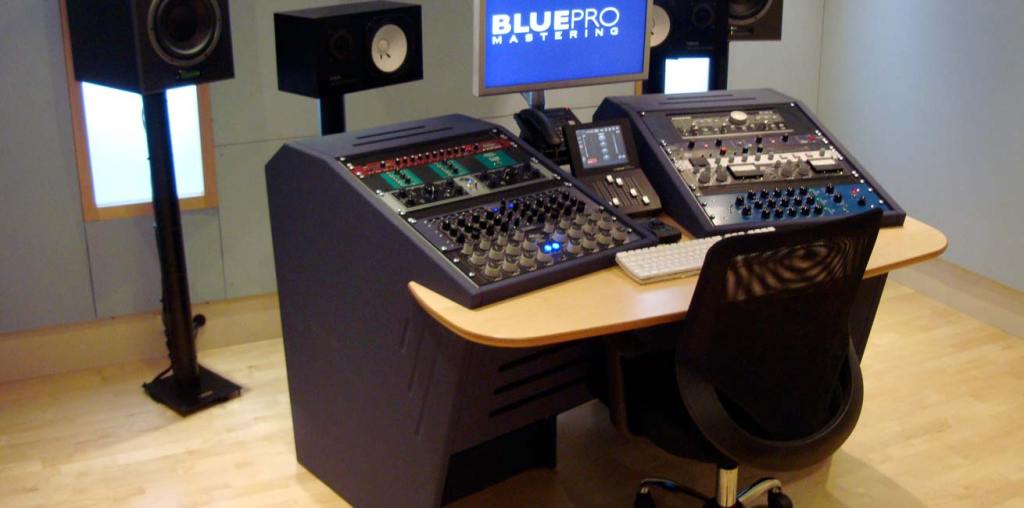
Room acoustics are the most important factor in building a mastering studio. Also, great quality ADC(Analog-Digital Converter)/DAC(Digital-Analog Converter), speakers and hardware are necessary too.
Building a mixing studio is also expensive. However, in mixing studio, audio hardwares take quite large volumes-they make room acoustics worse.
A desk with hardware may look good and fancy, but it takes up a lot of space. This can lead to comb-filtering effects. Removing the desk is a great solution, but as you know, it’s easier said than done..
One more thing, a mixing engineer listens to a song too many times, making it hard for them to recognize problems. Therefore, when you need to master a song or an album, I recommend hiring a mastering engineer.
Nevertheless a mixing engineer should provide a louder monitor file to clients than the mixed file. Due to budget constraints, mixing engineers sometimes have to master their own files.
In this chapter, for those situations, I’ll talk about the process and concepts about mastering.
Hello! I’m Jooyoung Kim, a mixing engineer and music producer.
Recently, I mentioned that I had written a simple paper in Korean. Initially, it was just a school assignment, but I decided to submit it as a formal paper rather than letting it collect dust.
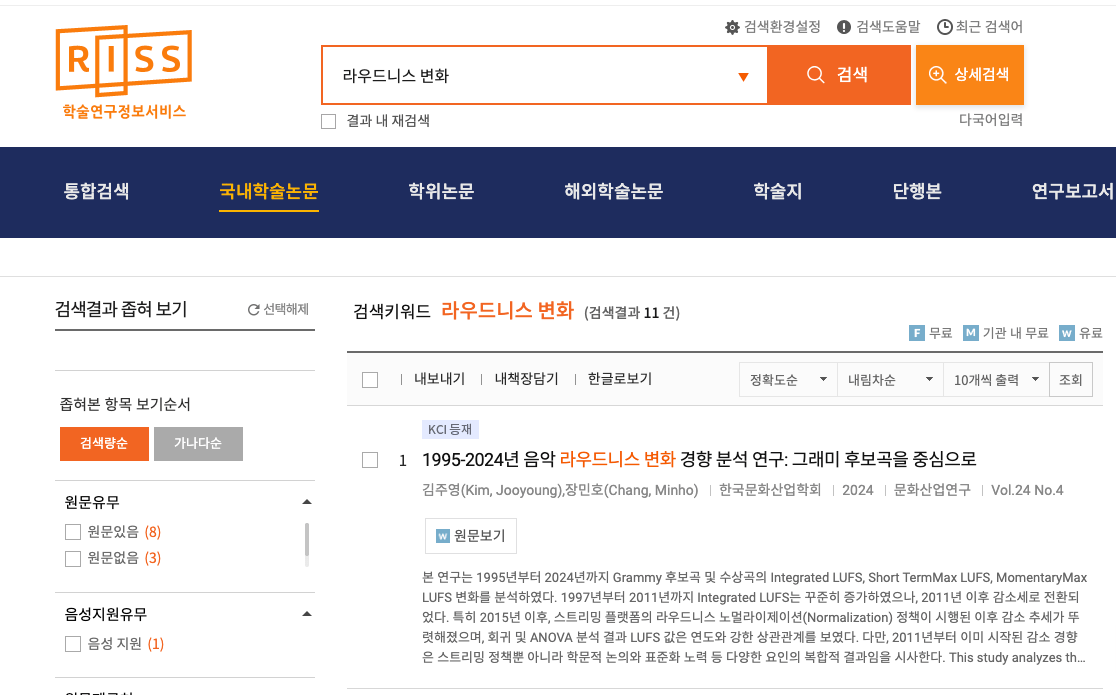
Today, I searched for it on RISS and found that it’s officially listed! So, I’d like to share some insights from it.
As the title suggests, this paper involved a lot of hands-on work and analysis. Here’s what I did:
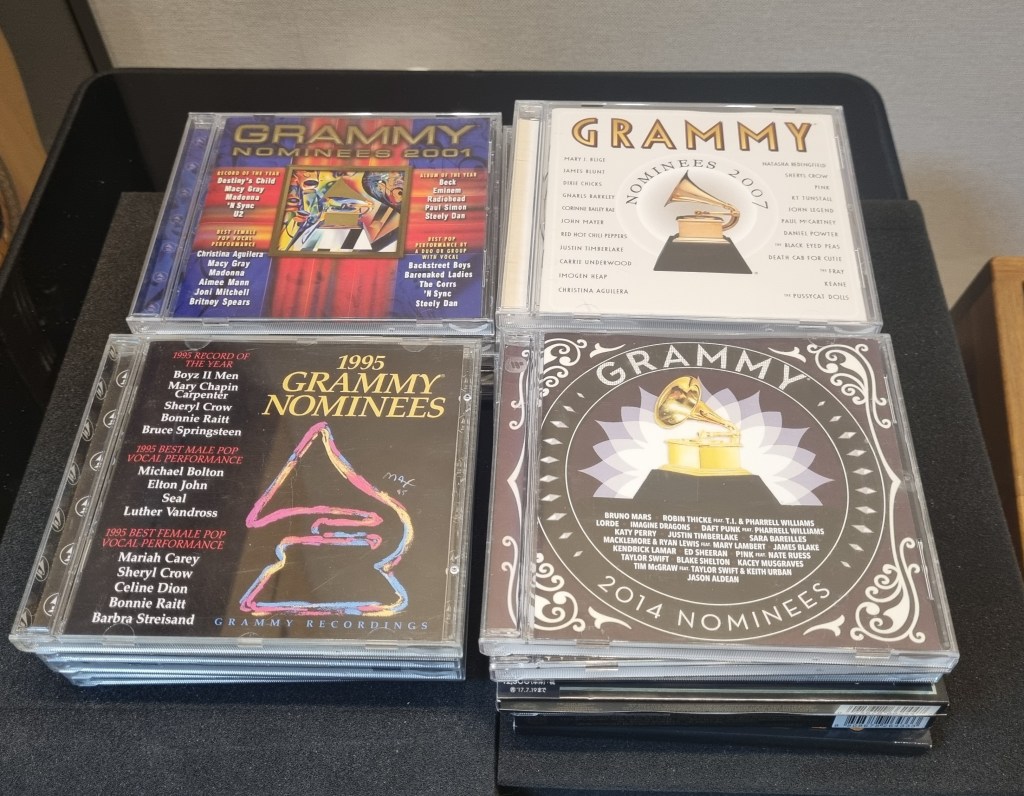
I tracked down GRAMMY Record of the Year nominees from 1995 to 2020 that were released on CD, importing the CDs directly from Japan.
From 2021 onward, CDs were no longer released due to declining sales. For these years (2021–2024), I purchased FLAC 44.1kHz/16-bit files for the nominees.
I extracted FLAC files from the CDs and measured their loudness values using the Youlean Loudness Meter.
This meter allowed me to measure Momentary Max, Short-Term Max, and Integrated Max LUFS (Loudness Units Full Scale). Using this tool, I processed a total of 520 songs.
Data Analysis
For analysis, I used common statistical methods like linear regression and ANOVA. While the statistical methods might not be particularly meaningful to engineers or artists, the results are worth noting.
In summary, I observed:
Starting in 2015 (just before loudness normalization became standard across music streaming platforms), the 3-year moving average of loudness began to decrease significantly in a linear trend.
Let’s break down the results with some key points about loudness:
LUFS (Loudness Units Full Scale) measures the perceived loudness of audio.
A value of 0 LUFS represents the maximum output level. Lower values (negative) indicate quieter audio.
Average Integrated LUFS by Year
Integrated LUFS represents the average loudness of a track from start to finish. Here’s the year-by-year trend:
Year
Average Integrated LUFS
2011
-7.9668
2012
-8.7532
2013
-8.5582
2014
-9.17
2015
-7.5467
2016
-8.7710
2017
-8.4776
2018
-8.27
2019
-8.7814
2020
-8.6533
2021
-8.1338
2022
-9.145
2023
-8.706
2024
-8.8175
This data reflects the overall average loudness of music in recent years.
Momentary Max LUFS by Year
Momentary Max LUFS represents the peak loudness within a short 0.4-second window. Below is the year-by-year trend:
Year
Average Momentary Max LUFS
2011
-4.3868
2012
-5.0709
2013
-4.5377
2014
-5.1439
2015
-4.2238
2016
-4.8648
2017
-4.4562
2018
-4.5686
2019
-4.9491
2020
-4.9752
2021
-4.4825
2022
-5.125
2023
-4.944
2024
-4.6863
Takeaways for Audio Engineers
From this analysis, I’ve noticed two important trends:
Integrated Loudness Levels:
In recent years, tracks with Integrated LUFS around -8 to -9 LUFS seem to be well within acceptable ranges, meaning engineers no longer need to obsess over achieving higher loudness levels.
Peak Loudness (Momentary Max LUFS):
Most highlights in songs fall within -4 to -5 LUFS. Standard deviation has also decreased over time, suggesting a narrowing range in peak loudness levels.
These findings could serve as helpful guidelines for mixing and mastering.
Personal Notes
Currently, I’m working on another audio-related paper using LaTeX—a tool that feels more like coding than writing! While it’s challenging, I’m preparing this paper for submission to the ASA (Acoustical Society of America), aiming for SCI recognition.
If rejected, I’ll submit it to AES (Audio Engineering Society) instead—or another venue if necessary.
I hope these insights into loudness trends prove useful for those in music production and audio engineering! If you have any questions about loudness, feel free to reach out via email.