I wrote a SCIE level paper!

Hello! This is Jooyoung Kim, a mixing engineer and music producer.

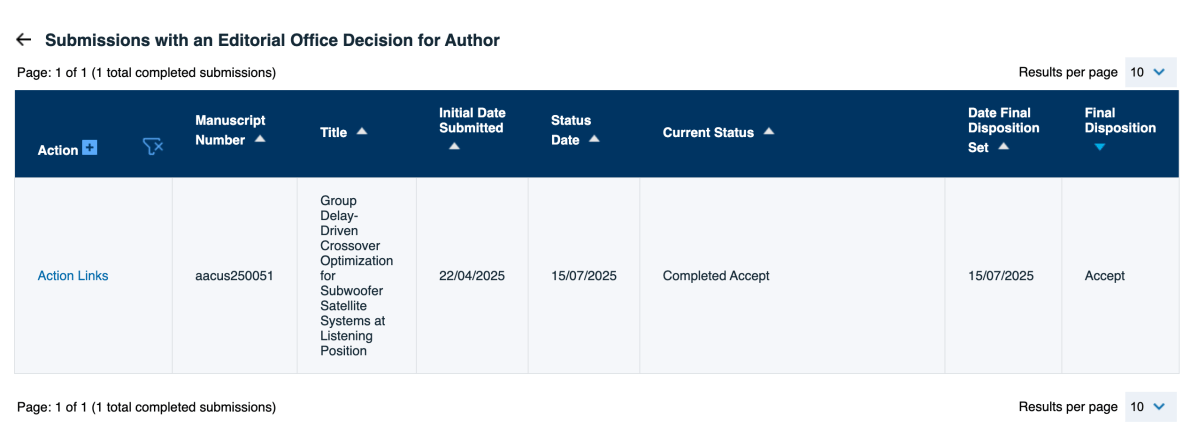
I’ve finally completed my personal challenge: getting a SCIE-level paper accepted before earning my master’s degree. Despite several rejections, it took me five and a half months to receive acceptance.

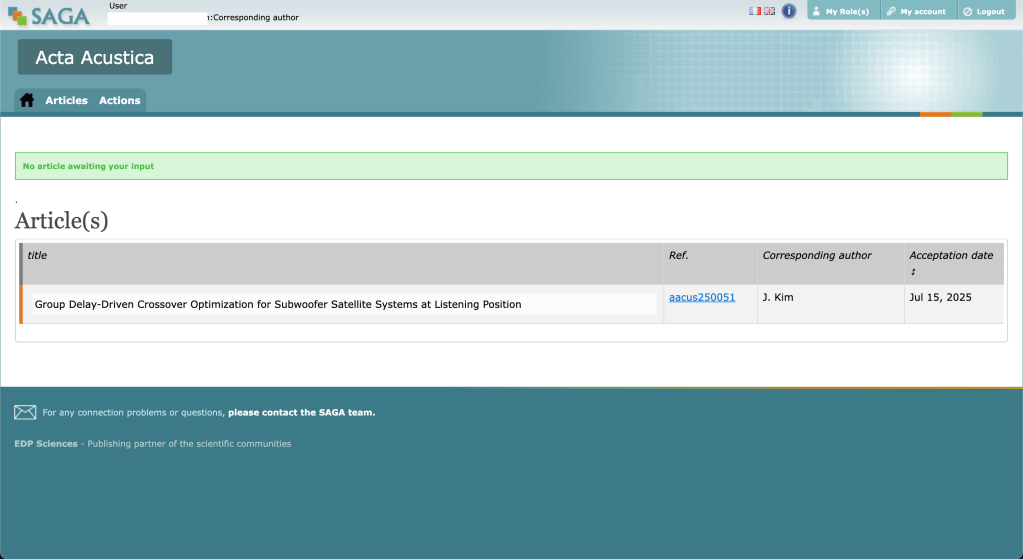
The paper has been accepted by Acta Acustica, a journal published by the European Acoustics Association (EAA), though it’s not officially published yet.

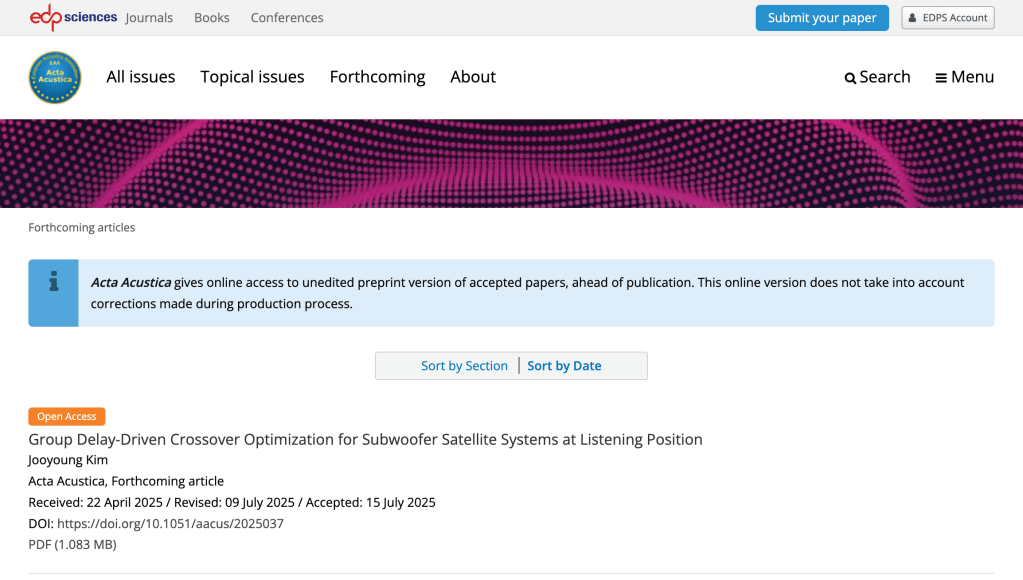
However you can see the prototype of the paper at “Forthcoming” page.

So, Acta Acustica, published out of France, feels like a journal with some solid history and tradition. But, maybe because it’s changed names a few times, it seems to have slipped a bit in the journal rankings.

Honestly, when it comes to music and acoustics journals, Impact Factor (IF) is practically useless for judging quality. It’s like they’re in their own little world! The top dogs, like the journals from the Acoustical Society of America (ASA) and the Audio Engineering Society (AES), are ranked Q2 and Q3 in JCR’s Acoustics category. Q3 for AES? That’s just absurd, right? 😅

Anyway, Acta Acustica is a notch below those two, sitting at Q3. Still, for music and acoustics research, there aren’t many other suitable journals out there besides these three. I was genuinely worried about getting rejected, so making it through feels like a huge relief.

Oh, and get this—acceptance doesn’t mean it’s published right away. There’s this final polishing phase handled elsewhere, and when I looked over my manuscript again, I spotted some typos… I’m planning to fix everything before submitting the final version.

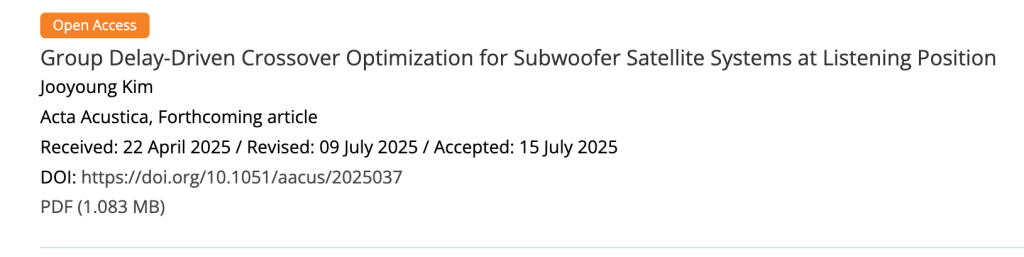
Also, you might’ve noticed from the author list—I wrote this paper as the sole author! It’s on the same topic as my master’s thesis, but I did everything on my own: no funding whatsoever, not even for the research itself. I used three subwoofers for the experiments—two were mine, and just one was borrowed from my professor’s personal stash. Even the measurement microphone was my own. I designed all the research methods from scratch, and I figured I should be the one handling revisions and post-publication queries as the corresponding author. I talked it over with my professor, who was super kindly lent me that one subwoofer. Huge thanks to him! 😄

The journey wasn’t easy—two rejections and some brutal feedback later, I had to tweak a lot of the research methods compared to my thesis. The conclusion ended up similar, but the paper itself feels like a different beast now.

Oh, and here’s the kicker: I had no money, and my university doesn’t cover publication fees or open access costs, so I was stressing out big time. But then, Acta Acustica turned out to be a Diamond Open Access journal—free for everyone to read and free for authors to publish!

I actually tried building an application based on this current work using Python, but there were way too many features to cram in, so I’ve put it on hold for now… haha.

And also I’m already thinking about my next research topic, and if it goes as planned, I might even turn it into a plugin.

Looking at how I barely touch social media like Instagram and stick to blogging, I guess writing’s just my thing. So, until my next post—catch you later!

Changes in Loudness Over the Years (1995–2024 GRAMMY Nominees)

Hello! I’m Jooyoung Kim, a mixing engineer and music producer.

Recently, I mentioned that I had written a simple paper in Korean. Initially, it was just a school assignment, but I decided to submit it as a formal paper rather than letting it collect dust.

Today, I searched for it on RISS and found that it’s officially listed! So, I’d like to share some insights from it.


As the title suggests, this paper involved a lot of hands-on work and analysis. Here’s what I did:

  1. I tracked down GRAMMY Record of the Year nominees from 1995 to 2020 that were released on CD, importing the CDs directly from Japan.
  2. From 2021 onward, CDs were no longer released due to declining sales. For these years (2021–2024), I purchased FLAC 44.1kHz/16-bit files for the nominees.
  3. I extracted FLAC files from the CDs and measured their loudness values using the Youlean Loudness Meter.

This meter allowed me to measure Momentary Max, Short-Term Max, and Integrated Max LUFS (Loudness Units Full Scale). Using this tool, I processed a total of 520 songs.


Data Analysis

For analysis, I used common statistical methods like linear regression and ANOVA. While the statistical methods might not be particularly meaningful to engineers or artists, the results are worth noting.

In summary, I observed:

  1. Starting in 2015 (just before loudness normalization became standard across music streaming platforms), the 3-year moving average of loudness began to decrease significantly in a linear trend.
  2. Let’s break down the results with some key points about loudness:
    • LUFS (Loudness Units Full Scale) measures the perceived loudness of audio.
    • A value of 0 LUFS represents the maximum output level. Lower values (negative) indicate quieter audio.

Average Integrated LUFS by Year

Integrated LUFS represents the average loudness of a track from start to finish. Here’s the year-by-year trend:

YearAverage Integrated LUFS
2011-7.9668
2012-8.7532
2013-8.5582
2014-9.17
2015-7.5467
2016-8.7710
2017-8.4776
2018-8.27
2019-8.7814
2020-8.6533
2021-8.1338
2022-9.145
2023-8.706
2024-8.8175

This data reflects the overall average loudness of music in recent years.


Momentary Max LUFS by Year

Momentary Max LUFS represents the peak loudness within a short 0.4-second window. Below is the year-by-year trend:

YearAverage Momentary Max LUFS
2011-4.3868
2012-5.0709
2013-4.5377
2014-5.1439
2015-4.2238
2016-4.8648
2017-4.4562
2018-4.5686
2019-4.9491
2020-4.9752
2021-4.4825
2022-5.125
2023-4.944
2024-4.6863

Takeaways for Audio Engineers

From this analysis, I’ve noticed two important trends:

  1. Integrated Loudness Levels:
    • In recent years, tracks with Integrated LUFS around -8 to -9 LUFS seem to be well within acceptable ranges, meaning engineers no longer need to obsess over achieving higher loudness levels.
  2. Peak Loudness (Momentary Max LUFS):
    • Most highlights in songs fall within -4 to -5 LUFS. Standard deviation has also decreased over time, suggesting a narrowing range in peak loudness levels.

These findings could serve as helpful guidelines for mixing and mastering.


Personal Notes

Currently, I’m working on another audio-related paper using LaTeX—a tool that feels more like coding than writing! While it’s challenging, I’m preparing this paper for submission to the ASA (Acoustical Society of America), aiming for SCI recognition.

If rejected, I’ll submit it to AES (Audio Engineering Society) instead—or another venue if necessary.

I hope these insights into loudness trends prove useful for those in music production and audio engineering! If you have any questions about loudness, feel free to reach out via email.

See you in the next post! 😊