Hello! I’m Jooyoung Kim, a mixing engineer and music producer.
Today, I was initially planning to talk about historically famous compressors. However, I realized that discussing the characteristics of these famous compressors might not be as effective since many of their plugin emulations don’t faithfully reproduce the original characteristics.
You might wonder how I can make such a claim without trying every famous compressor. Well, simply measuring their frequency response often shows no changes, and many plugins are designed to produce only odd or even harmonic distortions, which is unrealistic given the nature of tubes and transistors.
Instead of delving into the history of famous compressors, I decided it would be more beneficial to explain how to analyze compressors, whether they are plugins or hardware, once you purchase them.
1) Understanding Frequency Response

To measure this, you’ll need a program called Plugin Doctor by DDMF. Unfortunately, I couldn’t find any viable alternatives.
With this program, you can immediately see how the frequency response changes when a plugin or hardware is applied. Experienced mixers and producers might already have a feel for the frequency response just by listening, but visual aids can be incredibly helpful for study purposes.
For example, some plugins alter the frequency response depending on how the input gain is set.

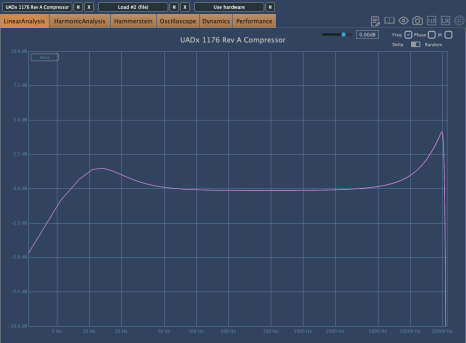
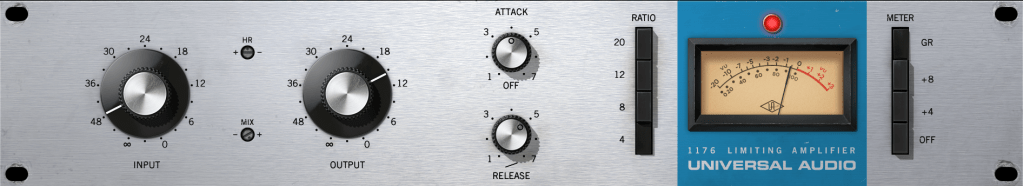
The above graph shows the frequency response of the UAD 1176 Rev A compressor. The left side shows the response with no changes, and the right side shows the response after increasing the input gain and adjusting the output gain.
Even a quick glance reveals significant differences.
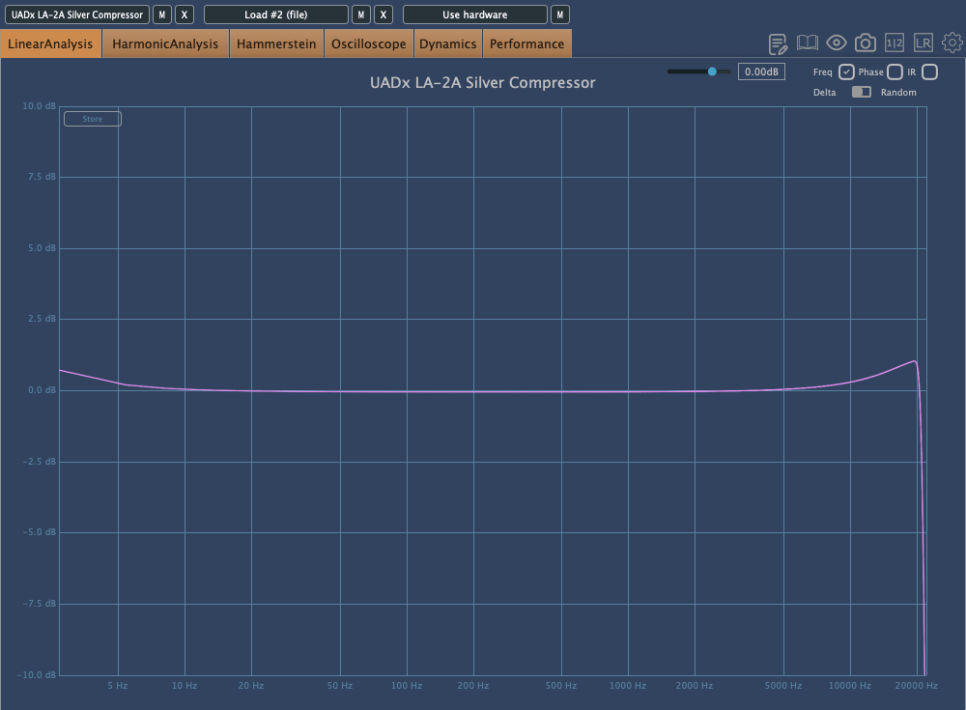
2) Analyzing Phase Changes

Phase changes can greatly assist in identifying affected frequency bands. The graph below illustrates the phase changes of a tape machine emulation, indicating substantial alterations across the spectrum.
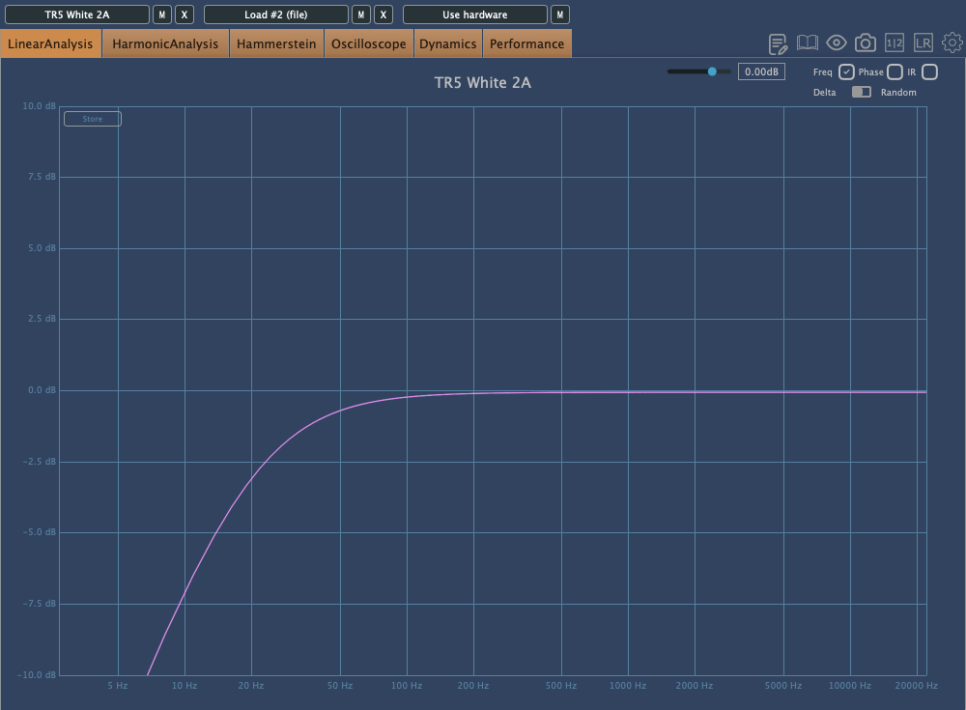
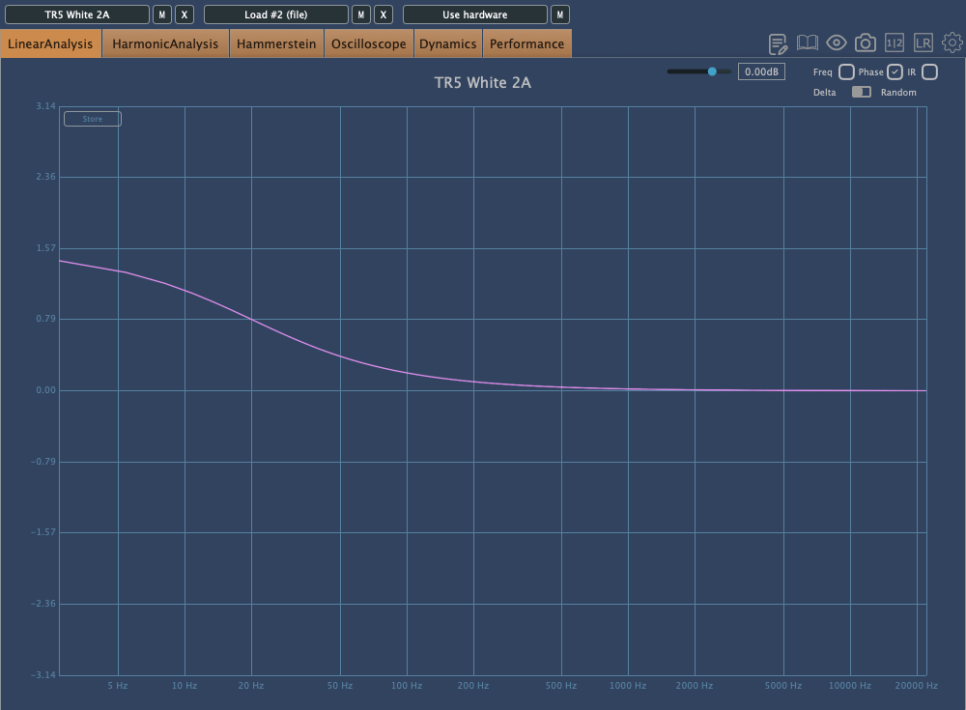
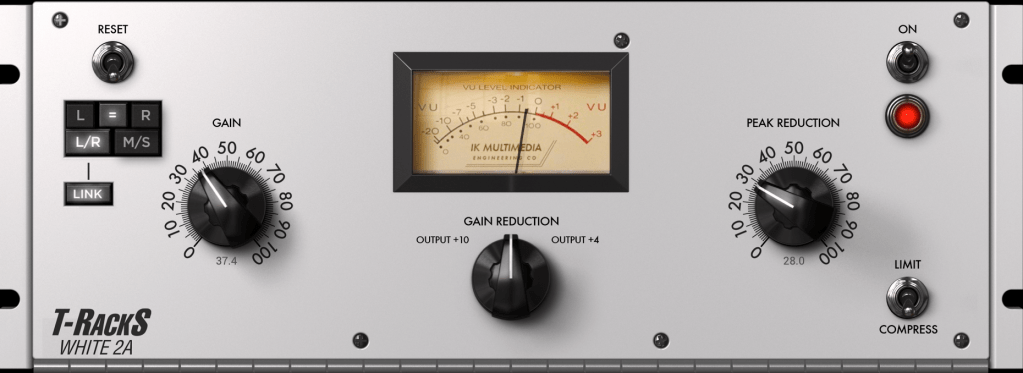
This graph shows the frequency response and phase changes of the White 2A compressor by IK Multimedia, which emulates the LA-2A.
From the frequency response, you can infer a low-cut filter was applied. The phase change graph suggests a π/2 shift, indicative of a -6dB/oct low-cut filter.
3) Assessing Harmonic Distortion
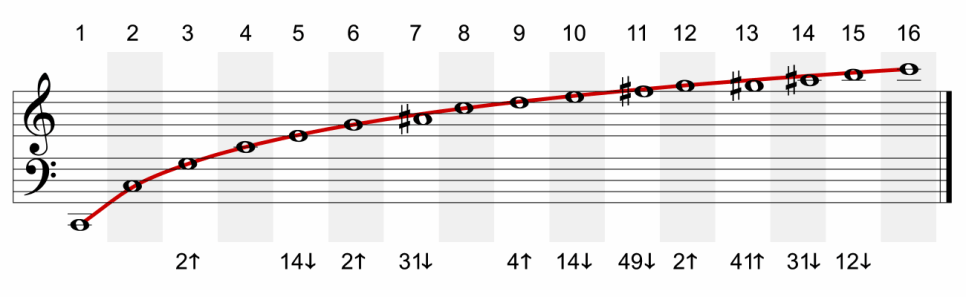
Harmonic distortion often refers to the presence of even and odd harmonics. Even harmonics tend to create a more pleasant sound due to their consonant nature, while odd harmonics can introduce dissonance and sound harsher.
By measuring and listening, you can identify whether a compressor produces more even or odd harmonics and how it affects your perception.

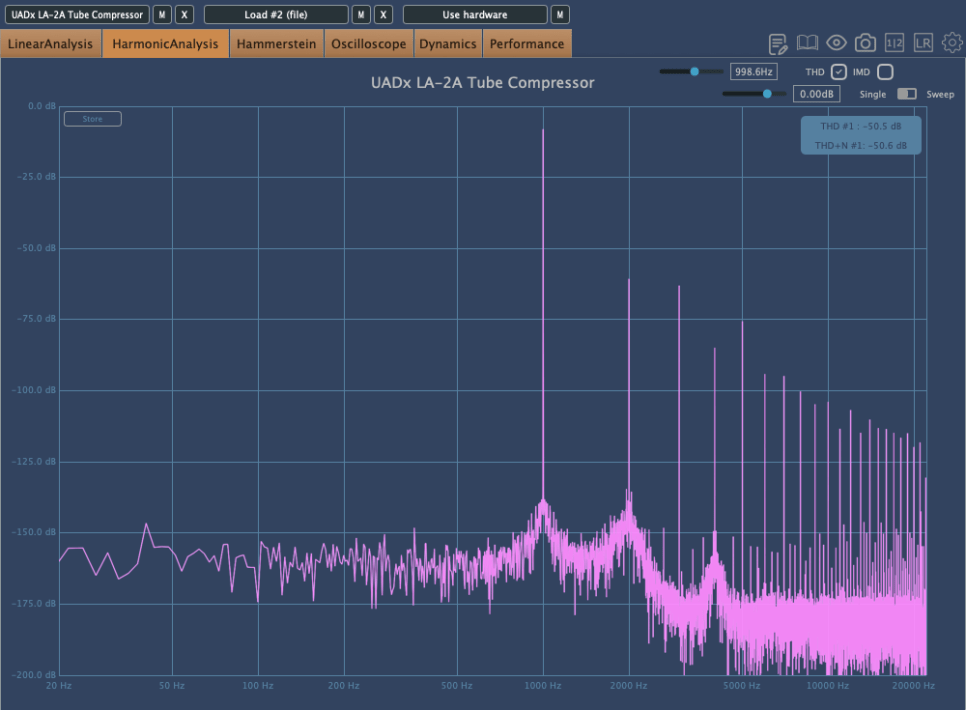
For example, I find the White 2A compressor somewhat dull, whereas the UAD LA-2A Silver feels richer in color.
This perception might be influenced by its slight high-frequency boost and the more complex harmonic distortion it introduces.

However, it’s important to note that more harmonic distortion doesn’t necessarily mean a better plugin. It simply provides insights into how and where to use it effectively.
4) Evaluating Attack and Release
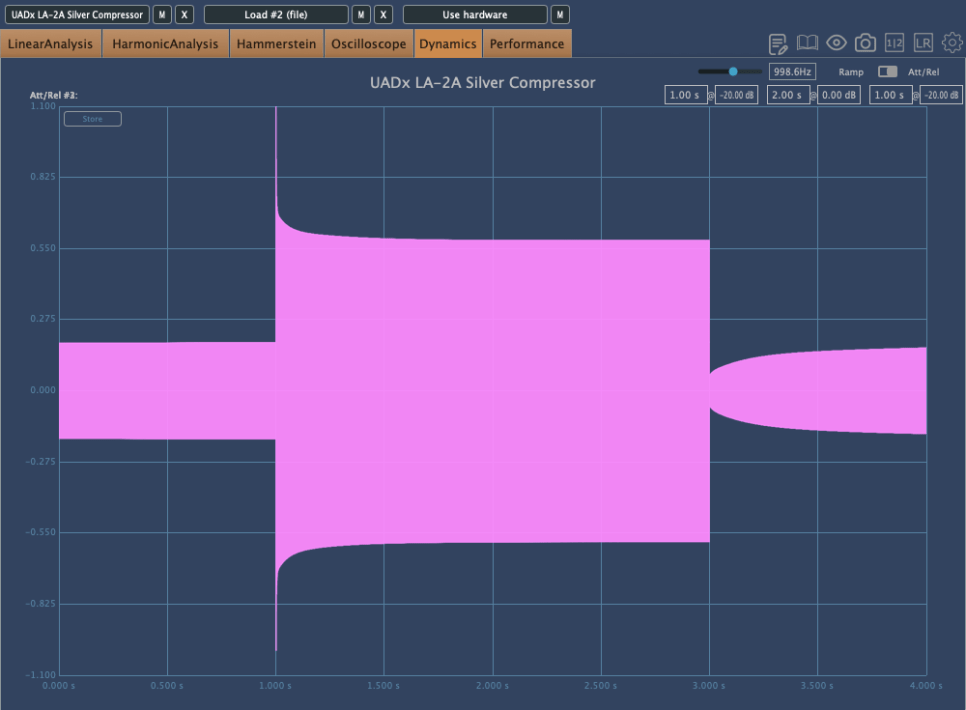
Although many plugins specify their attack and release times, some do not, necessitating manual measurement.
Using Plugin Doctor, you can visualize attack and release times with an oscillator. However, it doesn’t precisely indicate the time, which can be inconvenient.
A free tool called CMT can help here. You can download it from the description in a related YouTube video.
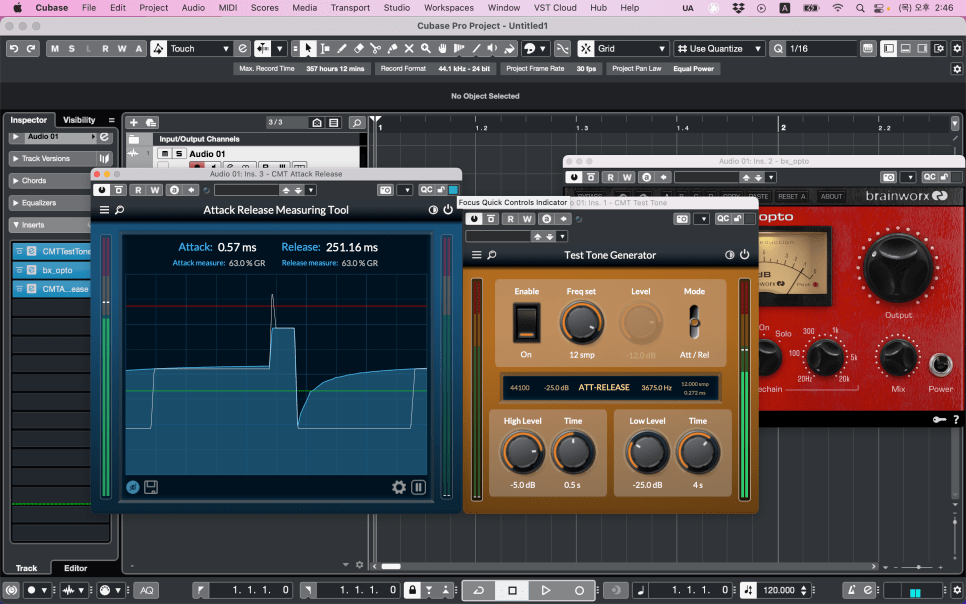
Knowing attack and release times is crucial because they influence how the compressor affects the source material’s groove and dynamics. Fast attacks can flatten a track’s groove, while fast releases can cause pumping effects.
Conversely, slow attacks may fail to control loud transients, and slow releases can cause continuous compression, making the sound feel squashed.
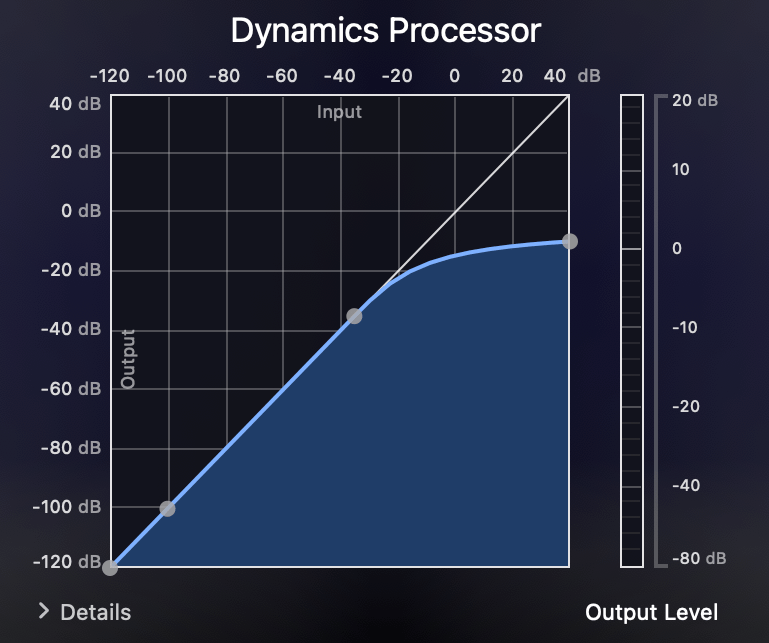
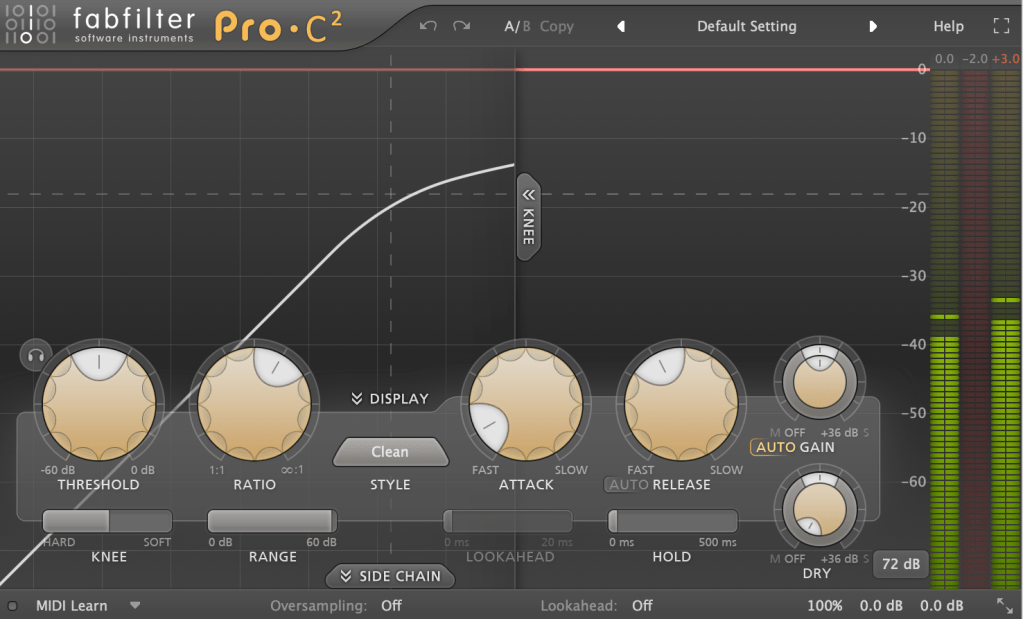
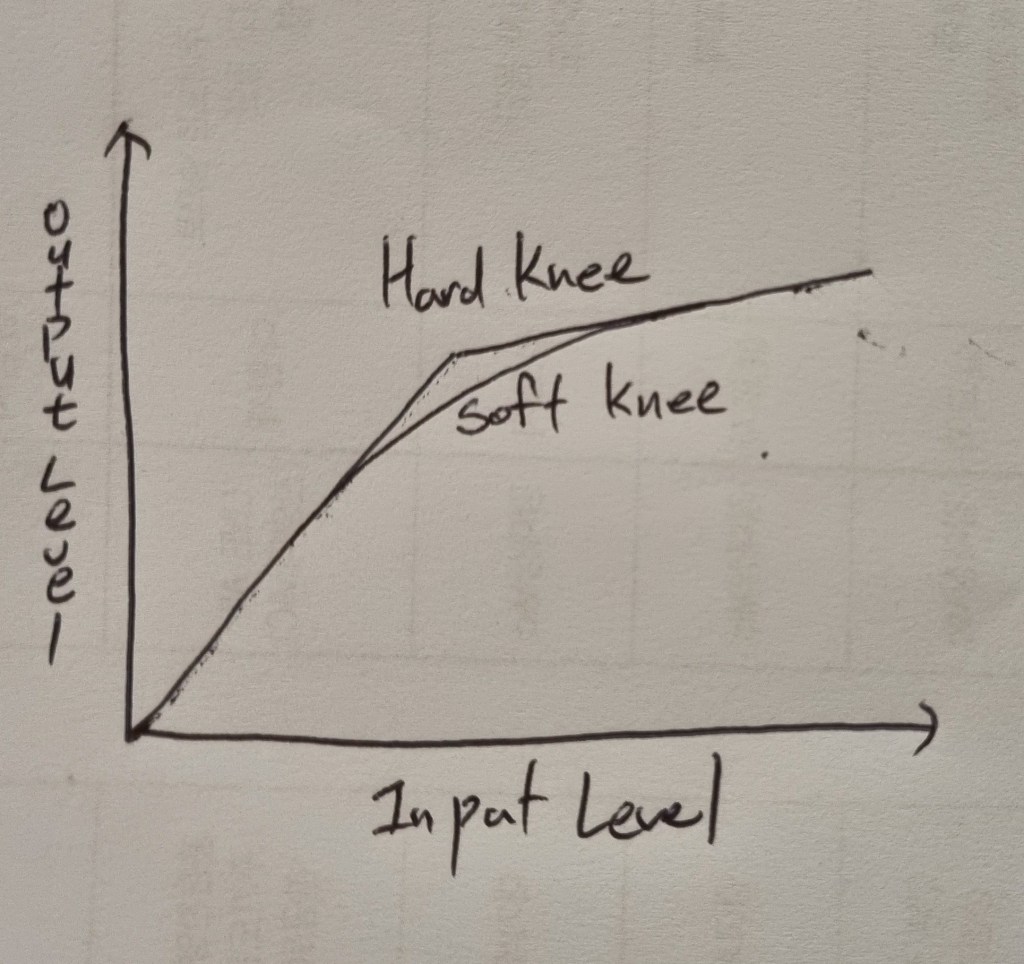
5) Examining Ratio Curves

Ratio curves reveal whether a compressor uses a soft or hard knee. A soft knee compressor starts compressing gradually before the threshold, resulting in smoother compression.
Manuals often don’t specify the knee type, so you might need to measure it yourself.
Understanding the knee type helps in grasping the compressor’s behavior and its suitability for different sources.
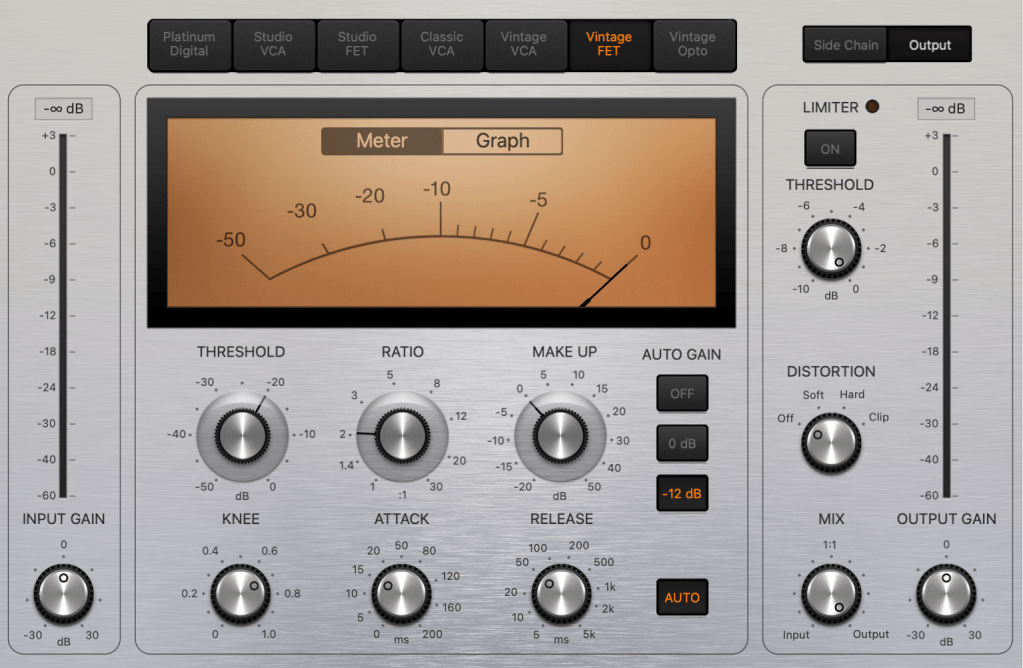
6) Soft Clipping in Mastering Compressors
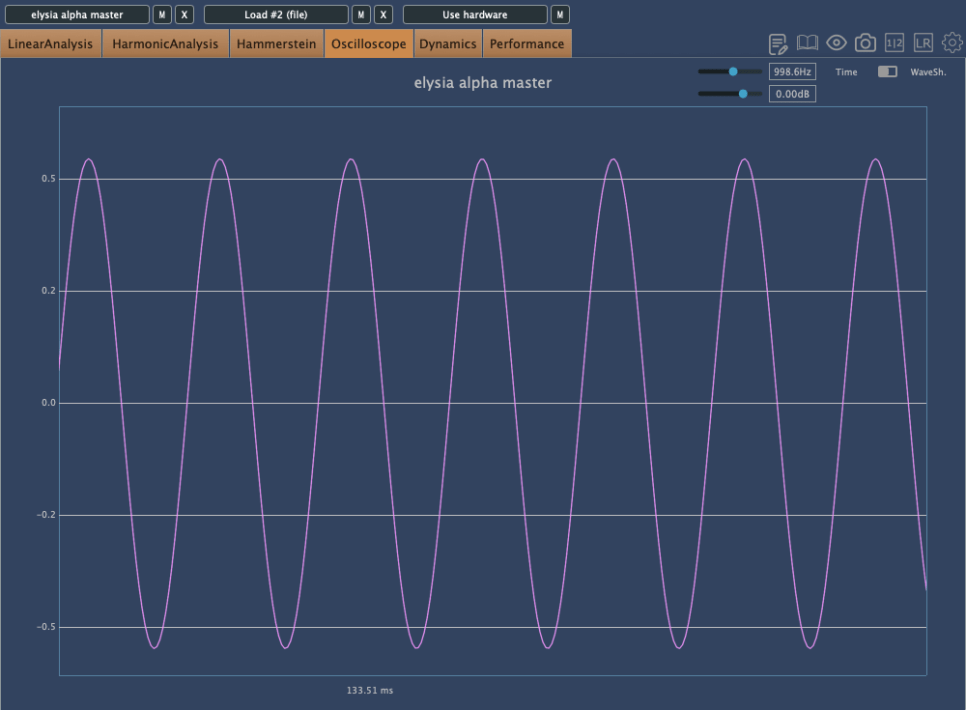

Some mastering compressors offer a soft clipping feature, which we’ll cover in detail later. Soft clipping changes harmonic distortion and waveform shape, as shown below.
Soft clipping rounds off waveform peaks, introducing non-linear harmonic distortion. The more it resembles hard clipping, the more noise-like it becomes.
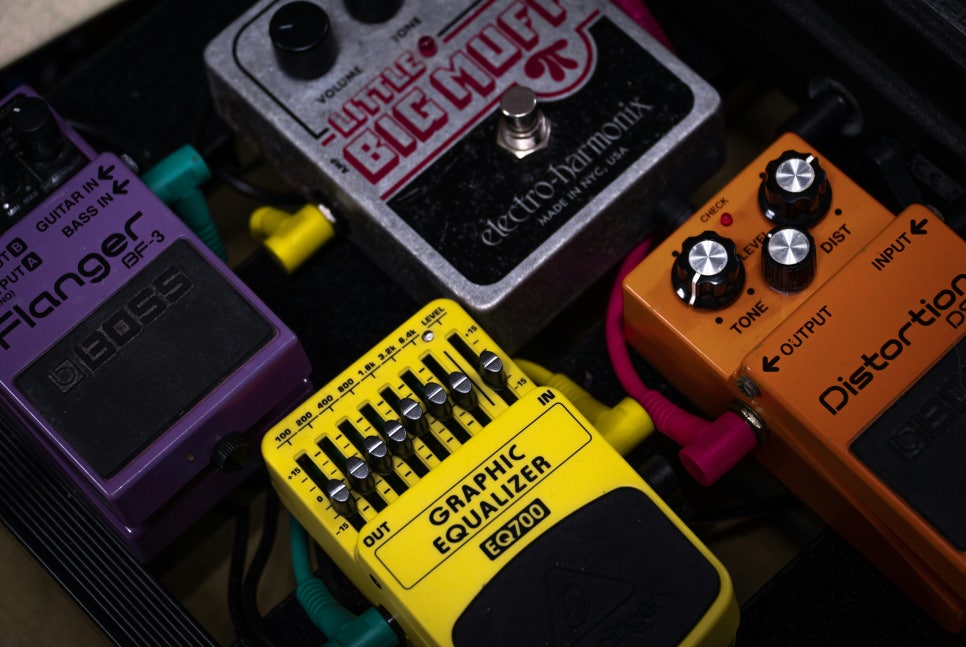
Think of a guitar distortion pedal for hard clipping and an overdrive pedal for soft clipping to understand the concept better.
Conclusion
Understanding these aspects will give you a solid grasp of a compressor plugin or hardware. Remember, you don’t need to memorize these values.
The key questions are:
- How does it sound when applied?
- How can it be used musically?
Measure and analyze your plugins/hardware, and listen to how they affect various sources. This combination of measurement and auditory experience will solidify your understanding.
Pay attention to how the source moves (up/down as discussed in Mixing Basics 2.4), how the tone changes, and how the compression feels. Being able to describe these in your own terms is a significant achievement.
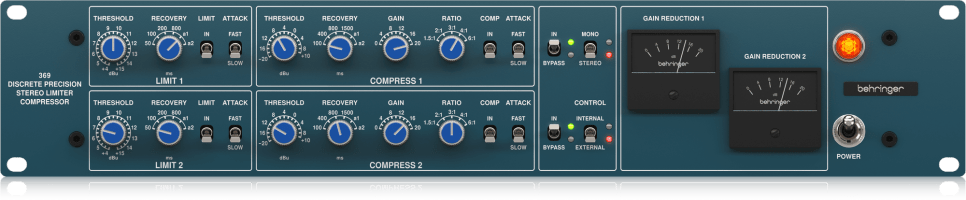
I continue to buy and use hardware because of these nuanced changes. Emulation plugins often lack the detailed frequency response and harmonic distortion of their hardware counterparts due to digital reproduction limitations.
However, using hardware doesn’t automatically improve your tracks. The key lies in understanding and using these changes appropriately to enhance your mixing and sound design.
Mixing is always challenging, as each track requires a different approach. With numerous plugins at your disposal, the choices can be overwhelming.
That’s it for today. See you in the next post!