Where’s the Future of Virtual Instruments and Performers Headed? Meet Melisma AI Strings & Woodwinds

Hey there! I’m Jooyoung Kim, an engineer and music producer.

AI-generated music has been making waves in the media for a while now, with research and commercial applications popping up left and right. But there are still some lesser-known AI projects in the music world—especially those leveraging unique learning methods—that deserve more attention.

Today, I want to introduce you to what I think is the most composer-friendly AI music tool I’ve come across lately. (No, this isn’t sponsored… haha!)

[link: https://kagura-music.jp/melisma]

Developed single-handedly by a creator in Japan, Melisma is seriously impressive—give it a listen, and you’ll be floored. This is still beta-stage audio, mind you. I first stumbled across it last year during its beta phase, and even then, it blew me away.


What’s Melisma All About?

Melisma takes sheet music in MusicXML format, sorted by instrument parts, and spits out incredibly natural-sounding audio. The quality hinges a lot on how well you write the articulations—those little details can totally change the vibe.

It’s got a list of supported and unsupported articulations, but even with that in mind… wow. It’s way cheaper than hiring real musicians and sounds so much more authentic than your average virtual instrument. I couldn’t help but wonder: are live performers, virtual instrument makers, and even string-focused studios in real danger now?

This got me thinking about my own future as a musician… 😢 I’ve actually started dabbling in AI learning research myself lately, but as a music creator, it’s a bittersweet feeling.


Mind-Blowing Realism

It’s not just strings either—check out the demo sounds, and you’ll hear woodwinds with breath noises so lifelike it’s insane. It almost feels like we’re entering a new era of score-writing. When I first heard it, I was hit with a wave of mixed emotions—excitement, awe, and a little dread.

They’ve got vocal synthesis too, but honestly, that part still feels a bit rough around the edges… haha. It’s not quite there yet.

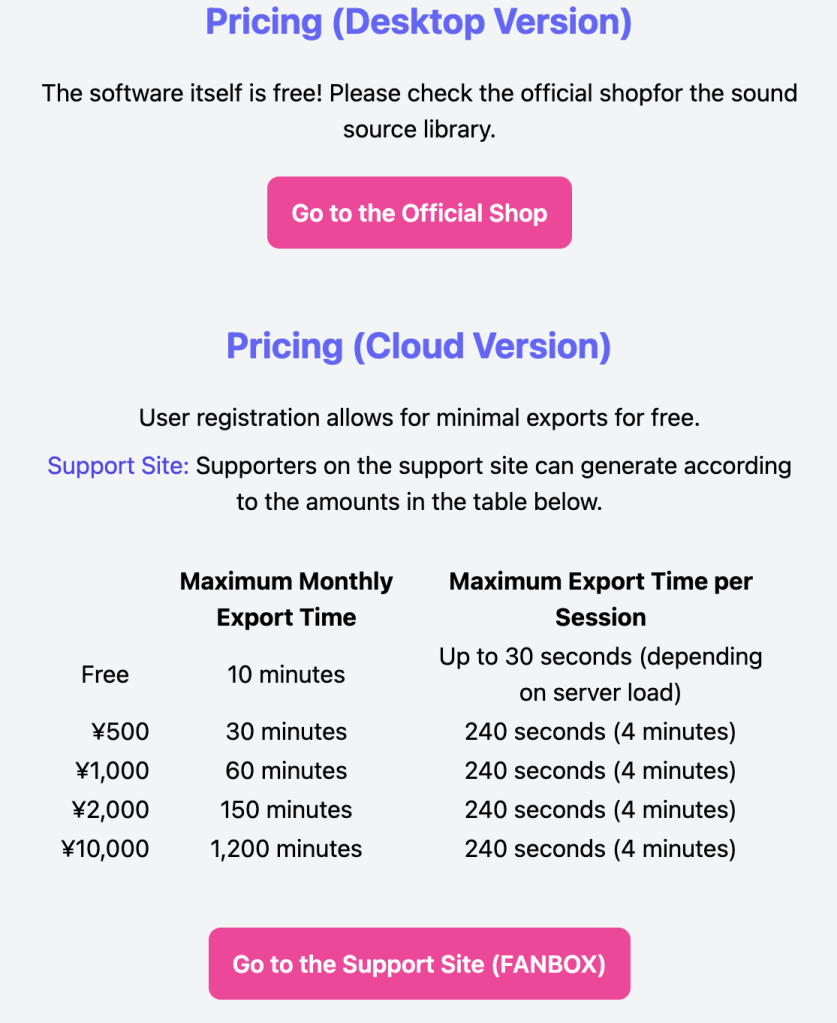
What really shocked me, though? The price. The standalone version (Windows-only for now) is just 15,000 yen per instrument—about the cost of a single virtual instrument plugin. Could this be the future of virtual instruments? I’m starting to think so.


Trying It Out

I mixed Melisma with some traditional string virtual instruments in an unreleased track of mine, and the results were pretty darn good. That said, every now and then, you get some odd, glitchy sounds popping up. It’s not perfect—sometimes you’ve got to tweak and regenerate to get it just right.

The developer, by the way, has a fascinating background—used to play recorder, composes a ton, and has a pretty unique resume. You can read more about them here: [link: http://nakasako.jp/about].


Recognition and Reflections

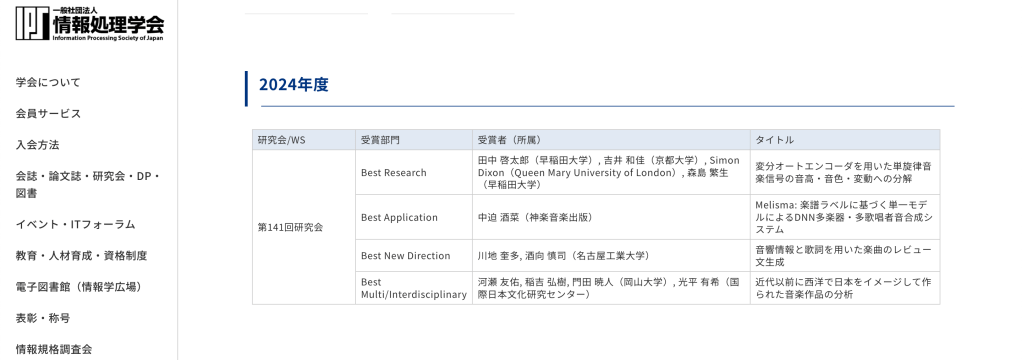
Last year, Melisma won the Best Presentation Award in the Best Application category at the Music and Computer (MUS) Research Group’s session during Japan’s Information Processing Society conference. That’s some serious cred!

It’s a reminder that the world doesn’t reward just one kind of obsession anymore. Old jobs fade, new ones emerge—it’s bittersweet to watch, but there’s no fighting the tide. That’s why I think it’s worth diving into all sorts of skills and studies; you never know what’ll come in handy.

Even I’m struggling to make ends meet sometimes, but to all my fellow musicians out there—let’s keep pushing forward!


Closing Thoughts

Melisma’s potential has me both excited and a little nervous about where music creation is headed. It’s a tool that could shake up how we think about virtual instruments and live performance—and at a price that’s hard to argue with.

That’s it for now—see you in the next post! 😊

Record Before Modifying the Stam Audio SA-2A

Hello, this is Jooyoung Kim, mixing engineer and music producer.
Until a few days ago, I was planning to sell my Stam Audio SA-2A second-hand and purchase a product from a Japanese brand.

However, it didn’t sell easily, and with the sudden rise in the Japanese yen… So, I decided to modify the unit myself instead of selling it.


Identifying the Problems

Here are the issues I identified with the SA-2A:

  1. Dissatisfying Sound
    • Excessive saturation and dull highs give the audio a muffled feel.
  2. Gain Parameter Adjustment
    • The output volume only matches the original level when the Gain knob is significantly reduced.
  3. Peak Reduction Sensitivity
    • Compression only activates when the Peak Reduction is turned up considerably.
  4. Limit and Compress Switch
    • The switch works in reverse.

Initial Steps in Modification

Addressing Problems #2 and #3

  • Inside the unit, I found a variable resistor labeled A100K.
    • This logarithmic resistor seemed unresponsive at lower ranges.
    • However, since we perceive audio in dB, it made sense to use a logarithmic curve for the Gain control.
  • I decided to replace:
    • Peak Reduction with a B100K (linear) resistor (ideally A200K, but it was unavailable).
    • Gain with a lower resistance A50K resistor.

I placed the order for these parts and will replace them soon.


Fixing Problem #4

  • The Limit/Compress switch was simple to resolve—just unscrewed it and rotated it half a turn.

Investigating Sound Quality Issues

The core problem remained the sound quality. After extensive research:

  • I contacted Stam Audio for the circuit diagrams.
  • I emailed Cinemag, the transformer manufacturer, to get specifications for the input/output transformers:
    • Input: Cinemag CM-5722, winding ratio 1:5.
    • Output: Cinemag CM-2570, winding ratio (18:2):1 = 9:1.

While considering transformer replacements (e.g., Sowter), I found several insights:

  1. Cinemag’s CM-5722 input transformer is already highly rated and doesn’t need replacement.
  2. Discussions on Gear Space suggested that tubes or the T4 cell impact the sound more than transformers.
  3. A post from 2016 or 2017 on Gear Space mentioned that replacing a single input tube can significantly improve sound.
  4. A YouTube video comparing various 12AX7 tubes on a Marshall amp highlighted sound differences between tube brands.

From this, I concluded that the JJ Electronics 12AX7 (ECC83) used in the V1 position is likely the main culprit behind the sound I dislike.

Based on the video, the JJ Electronics tube produced a tone that immediately felt off to me.


Planned Tube Replacements

I decided to replace:

  • V1 Tube: JJ Electronics ECC83 with Mullard 12AX7, a sound I much prefer.
  • V4 Tube: JJ Electronics ECC83 with another Mullard 12AX7 for consistency.

However, due to unexpected expenses this month (e.g., AES membership fees, domestic conference fees, paper review fees, and repairs for another compressor), I’ll postpone the tube replacement until next month.


Side Discovery: DIY Compressors

While researching, I stumbled across a site selling DIY cases and PCBs.

https://collectivecases.com/

While there are plenty of LA-2A clones on the market, the PYE compressor clone caught my eye.

  • PWM-based compressors are rare, and even the clones are scarce.
  • The original units are prohibitively expensive.

Although the schematics look complex and sourcing components would require significant time and money, I feel deeply drawn to this project. Maybe someday, with enough budget, I’ll take it on.


For now, this concludes my record of the SA-2A before modification. Once I replace the tubes and complete further changes, I’ll share my experiences and the sound improvements in a follow-up post.

See you in the next update! 😊

Types and connections of patchbays, configuration of the system

This article was written on July 17, 2023. It is different from my current audio system, but I translated it and wrote it because I thought it would be helpful in planning the patch bay. Good luck!

Hello, I’m Jooyoung Kim, an engineer and music producer.

As musicians and engineers accumulate more hardware equipment, they often consider adding a patch bay to their setup. Today, I’d like to discuss patch bays and their usage. Let’s dive in!

Types of Patch Bays

There are various standards for patch bays, primarily categorized based on connector types:

  1. TRS
  2. XLR
  3. Bantam (TT)

You’re likely familiar with TRS and XLR connectors, but Bantam might be new to you. Due to its smaller size, Bantam connectors are commonly used in 1U patch bays, which can accommodate up to 96 holes.

However, TRS patch bays can have up to 48 holes and XLR patch bays can have up to 16 holes.

TRS and Bantam patch bays are further categorized based on internal connection methods:

  1. Normal (Full-Normal)
  2. Half-Normal
  3. De-Normal (Non-Normal/Thru)

Once you understand these, it becomes straightforward:

Normal (Full-Normal): The rear signal is connected without plugging in a cable at the front. Plugging in a front cable disconnects the rear connection.

Half-Normal: Like Full-Normal, but plugging in a front cable splits the signal for parallel processing.

De-Normal (Non-Normal/Thru): I opted for a patch bay that supports all three modes, even though I primarily use Full-Normal.

I bought Samson S-Patch: It supports all three modes, but labeling can be tricky due to the narrow spacing.

Configuring Your Patch Bay

Knowing the types of patch bays, the next step is planning your setup. Begin by listing the In/Out of your equipment. Here’s an example with my gear:

EquipmentInOut
Orion Studio Synergy Core12Line Out 16 /
Monitor Out 4
Dangerous 2Bus16Main Out 2 /
Monitor Out 2
Heritage Audio HA73EQ
(Mic Pre)
0 (Mic In not considered)1
OZ design OZ-2200
(Mic Pre)
0 (Mic In not considered)2
Bus CompressorLine In 2 / Side Chain 12

Prioritize your connections:

  • Out on top, In on the bottom for signal flow from top to bottom in Full and Half-Normal patch bays.
  • Begin with the equipment with the most Ins and Outs.

Although there are some limitations, like not fully utilizing some of Antelope’s Ins and the mic preamps’ Line Ins, this setup is efficient without wasting patch bay channels. For mic preamp Line Ins, external cable connections can be made as needed.

And label your patch bay accurately. You can find companies that print labels, but they may charge high shipping fees. Alternatively, you can cut paper strips for labeling.

I purchased an 8-pack TRS patch cable bundle from Hosa, available at an affordable price on Amazon.

With this setup, your patch bay-based system configuration is complete. While my setup focuses on mixing hardware, those using hardware synthesizers can also benefit from a patch bay to enhance their workflow and creativity.

I hope this information is helpful to all music enthusiasts. See you in the next post!

Choosing Speakers by Reading Spinorama Charts!

Hello! this is Jooyoung Kim, an engineer and music producer.

Today, I’d like to explain Spinorama, a concept anyone interested in sound and speakers should know. Let’s get started!

Example of a Spinorama Graph

First, let’s briefly look at the history of how Spinorama measurements were developed.

Spinorama was created in the 1980s by Dr. Floyd Toole, a leading authority on speaker acoustics, while he was working at the National Research Council of Canada. In the 1990s, it was further refined in collaboration with Harman International. It has since been incorporated into standards issued by the American National Standards Institute (ANSI) and the Consumer Electronics Association (CEA).

Standard Method Of Measurement For In-Home Loudspeakers

The measurement process, as shown above, involves taking measurements every 10 degrees horizontally and vertically in an anechoic chamber, resulting in a total of 70 data points.

This looks intense…

The collected data is represented in six frequency response graphs known as Spinorama charts.

KEF R3 META

Let’s look at the Spinorama graph for my recently purchased KEF R3 META. The vertical axis is dB SPL (the unit we often use to measure sound levels, like airplane noise), and the horizontal axis is Hz (the unit of frequency).

  1. The top blue line is the On Axis response, representing the frequency response directly in front of the speaker. Manufacturers commonly provide this graph, but it lacks comprehensive information.
  2. The second orange line is the Listening Window response, which averages the frequency responses from ±10 degrees vertically and ±30 degrees horizontally, totaling 9 measurements. This approximates the expected response in a typical listening environment.
  3. The third red line represents Early Reflections, showing the response of early reflected sounds. It averages 8 measurements taken at ±40, ±60, and ±80 degrees horizontally, and ±50 degrees vertically. A significant difference from the On Axis and Listening Window responses helps distinguish between direct and reflected sounds.
  4. The light blue Sound Power response averages all 70 measurements. The more this graph parallels the other graphs without significant fluctuations, the better the speaker’s acoustic performance.
  5. The green Early Reflections DI (Directivity Index) is the difference between the On Axis and Early Reflections responses. This graph helps to quickly understand the difference between direct and reflected sounds.
  6. The brown Sound Power DI is the difference between the On Axis and Sound Power responses. Research suggests that smoother changes in both DI graphs are preferred by listeners (I’d provide the exact study, but finding it would take some time… I’ll update if I come across it later).
Genelec 8351B
  1. The On Axis chart shows the basic frequency response.
  2. The closer the Listening Window response is to the On Axis response, the more similar the sound will be for the listener and those around them. This indicates good off-axis performance, meaning the sound remains consistent even if the listener moves slightly.
  3. The more aligned the Early Reflections, Sound Power, and On Axis graphs are, the higher the preference among listeners. If it’s hard to judge, check the DI graphs for a consistent slope.

This gives a basic understanding of Spinorama charts.

Of course, Spinorama charts have their limitations. As the title suggests, you shouldn’t choose a speaker based solely on these charts. However, they are a fundamental indicator for understanding a speaker’s performance, making them valuable knowledge for anyone in music or sound.

In future posts, I’ll discuss near-field measurements by the German company Klippel.

Finally,

https://www.spinorama.org/

This site offers Spinorama charts for many speakers measured so far. Since it aggregates data from various sources, make sure to choose highly reliable sources in the settings tab for accurate information.

I hope this post is helpful for you! See you in the next post!